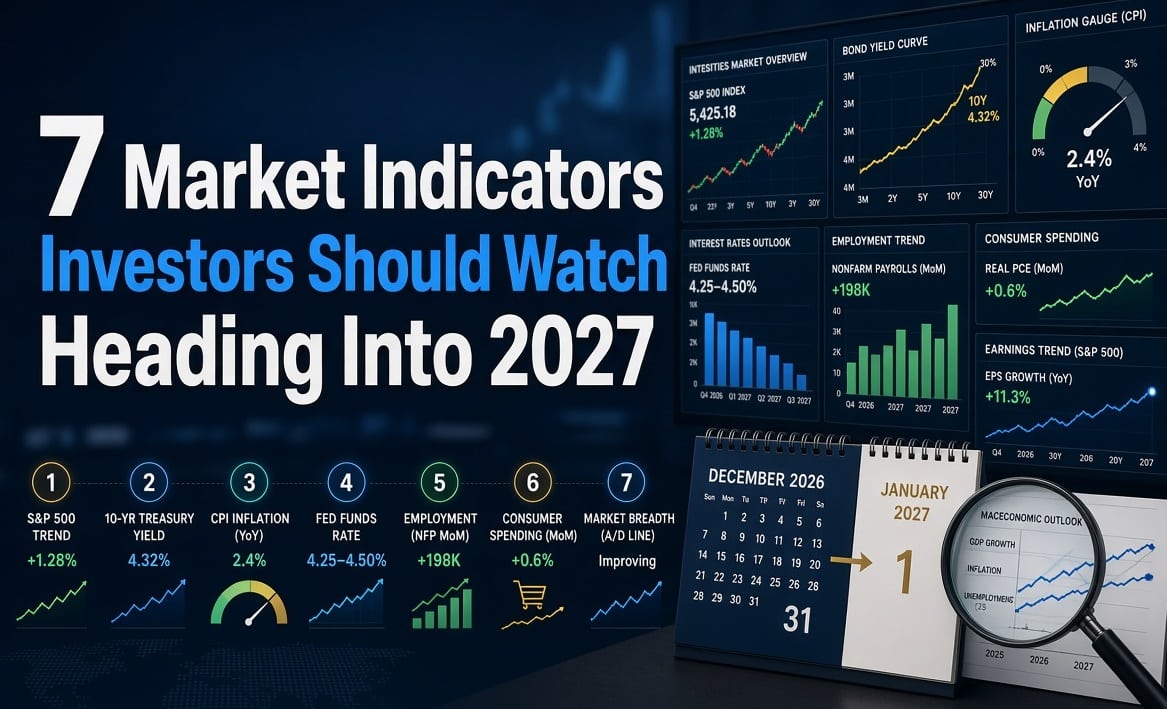
Investors heading into 2027 face a market landscape full of crosscurrents: resilient earnings, shifting interest-rate expectations, uneven consumer demand and geopolitical risk. The 7 market indicators investors should watch heading into 2027 can help separate meaningful trend changes from daily noise.
From inflation and bond yields to credit spreads, market breadth and corporate guidance, these signals offer a practical framework for monitoring risk and opportunity. Used together, not in isolation, they can support clearer decisions as conditions evolve.
Key takeaways
- Track inflation’s sources, services, wages, housing and commodities, not just headline price changes.
- Watch labor-market breadth, wage growth and hours worked for early signs of economic weakening.
- Fed expectations and real yields can quickly reshape valuations, borrowing costs and long-duration asset performance.
- Use Treasury yields, yield-curve shifts and credit spreads together to assess financial conditions and risk appetite.
- Prioritize earnings revisions, durable margins and cash generation over headline revenue growth.
- Pair equity valuations with market breadth; narrow leadership can mask underlying market fragility.
The 7 market indicators investors should watch heading into 2027
As 2027 approaches, the market is likely to reward investors who look beyond headline moves and focus on the signals beneath them. These seven indicators offer a practical framework for testing an investment thesis, spotting shifts in risk, and separating durable trends from short-term noise. Used together, they can turn market insights into more measured portfolio decisions.
1. Inflation trend and composition
Inflation matters not simply because prices are rising, but because the source of those increases shapes the policy and investment response. Investors should distinguish between sticky services inflation, housing costs, wages, and more volatile categories such as food and energy markets. A decline driven mainly by lower oil prices is different from broad-based easing across the economy.
Watch monthly data alongside longer-term measures, including core inflation and inflation expectations. The global market can also reintroduce price pressure through shipping disruptions, tariffs, or commodity shortages. If inflation proves persistent, interest rates may stay restrictive for longer, weighing on rate-sensitive assets. If it cools cleanly without economic weakness, the backdrop becomes more supportive for a wider range of investments.

2. Labor-market conditions
The labor market remains one of the clearest readings on whether economic growth is holding up or beginning to soften. Payroll growth, unemployment claims, wage gains, job openings, and participation rates each reveal a different part of the picture. A healthy market is not necessarily one with exceptionally rapid hiring; it is one where demand and labor supply are coming into better balance.
Pay close attention to hiring across industry groups. Weakness concentrated in a few cyclical sectors may be manageable, while broad layoffs and falling hours worked can have larger financial consequences for households and businesses. Global developments matter too, particularly in export-oriented industries. For Steady Income investors, the most useful market insights come from asking whether wages support consumer spending without reviving inflation pressure, a balance central to the next phase of the cycle.

3. Federal Reserve expectations and real yields
Markets often move on changes in Federal Reserve expectations before the central bank makes a decision. Follow not only the level of policy interest rates, but also the path investors expect over the next year or two. A shift toward fewer rate cuts can affect equity valuations, bonds, currencies, and borrowing costs almost immediately.
Real yields, the return on Treasury securities after accounting for expected inflation, deserve equal attention. Rising real yields can tighten financial conditions even when nominal rates appear stable, challenging expensive risk assets and highly leveraged companies. Falling real yields, by contrast, can improve the investment outlook for long-duration assets, including growth-oriented equities. The key is context: lower yields caused by fading inflation are generally constructive; lower yields caused by recession fears call for more caution. Investors should treat Fed pricing as a live indicator, not a forecast set in stone.
4. Treasury yields and the yield curve
Treasury yields set the reference price for much of the financial system, from mortgages and corporate loans to equity valuations. Monitor both the two-year and 10-year Treasury yield, rather than relying on a single headline rate. The difference between them, the yield curve, can reveal how the market outlook is evolving for growth, inflation, and monetary policy.
A curve that steepens because longer-dated yields rise may reflect inflation concerns, heavy government borrowing, or investor demand for greater compensation to hold duration. That can pressure bond prices and rate-sensitive shares. A steepening led by falling short-term yields may instead signal anticipated policy easing. Use yield-curve data alongside credit spreads and corporate earnings, not in isolation. For an investment portfolio, the practical question is whether yields offer attractive income without creating a material capital-risk trade-off if rates move further.
5. Corporate earnings revisions and profit margins
Share prices can outrun earnings for a time, but profits ultimately anchor the value of a stock. Heading into 2027, watch whether analysts are raising or cutting earnings estimates, especially after companies report results. Broad upward revisions suggest demand and pricing power are holding up; repeated downgrades can indicate that expectations were too optimistic.
Profit margins provide the necessary second check. Revenue growth is less meaningful if rising labor, financing, or input costs are eroding what companies keep. Compare margins within an industry, since a company that protects profitability better than its peers may have a genuine competitive advantage. Investors should also read management commentary and SEC filings for evidence behind the numbers. Strong stocks are not always those posting the fastest sales growth; durable shares often belong to businesses that convert revenue into cash through varied economic conditions.
6. Credit spreads and lending conditions
Credit spreads measure the extra yield borrowers must pay above comparable government bonds. When spreads widen, investors are demanding more compensation for default risk; when they narrow, confidence is generally improving. This makes them an early and useful check on the appetite for risk assets, particularly when stock indexes remain near highs.
Lending conditions matter just as much. Bank surveys, loan growth, delinquency trends, and refinancing activity show whether households and businesses can access capital on reasonable terms. Tight financial conditions can slow hiring, spending, mergers, and capital investment long before a downturn appears in headline economic data. A modest widening in spreads is normal, especially after a strong market run. A rapid, broad move higher, combined with weaker lending, deserves closer attention. For income-focused investing, favoring balance-sheet strength can be more valuable than reaching for the highest available yield.
7. Equity valuations and market breadth
Valuation is a discipline, not a market-timing tool. Investors should assess the stock market using several measures: forward earnings multiples, free-cash-flow yield, dividend growth, and the relationship between prices and interest rates. High valuations can persist when earnings are strong, but they leave less room for disappointment if growth slows or yields rise.
Market breadth reveals whether gains are being shared. If only a small group of growth stocks is advancing while most shares lag, index performance can look healthier than underlying participation suggests. Broader leadership across sectors, company sizes, and regions is usually a more resilient sign. Keep crypto assets and emerging market equities in perspective as well: their performance can reflect liquidity and risk appetite, but not necessarily the health of domestic equities. The most useful insights come from pairing valuation with breadth, asking not only what investors are paying, but how widely confidence is distributed.

Valuation and breadth checklist
- Review forward price-to-earnings multiples alongside free-cash-flow yields, dividend growth, and prevailing interest rates.
- Treat high valuations as a risk consideration, not a reliable signal to exit the market immediately.
- Assess whether earnings strength supports current prices and leaves room for slower growth or higher yields.
- Check market breadth: determine whether gains extend across sectors, company sizes, and regions.
- Be cautious when a narrow group of growth stocks drives index returns while most shares lag.
- Favor broader leadership as a sign of more durable investor confidence and market resilience.
- View crypto assets and emerging-market performance as liquidity indicators, not direct measures of domestic equity health.
Market insights: Reading conflicting signals
Today’s market insights demand more patience than prediction. Inflation may be easing in some economies while wage pressures and service costs remain stubborn; central banks may be nearing rate cuts, yet bond markets can quickly reprice the timing. For investors, that creates a familiar but uncomfortable mix: encouraging headlines alongside meaningful downside risk.
I look beyond any single data release. The more useful insights come from observing how interest rates, company earnings, currencies and consumer confidence interact. A resilient labour market can support spending and corporate profits, for example, but it can also delay lower borrowing costs. Equally, softer growth may ease inflation, although it can put pressure on cyclical businesses and risk assets.
The global market adds another layer. Elections, trade policy, energy prices and geopolitical events can affect portfolios well beyond their point of origin. Rather than treating every shift as a call to act, I see these signals as a reason to check whether holdings still match their purpose. A portfolio built for dependable income should not depend on one economic outcome. Diversification, balance-sheet quality and realistic expectations matter most when the market appears to be saying two things at once.
How Conflicting Market Signals Can Affect Portfolios
| Market signal | What it may indicate | Potential portfolio consideration |
|---|---|---|
| Easing inflation alongside persistent wage pressure and service costs | Price pressures may be moderating unevenly, with some inflationary forces remaining stubborn. | Review whether portfolio expectations account for inflation that may take time to ease fully. |
| Central banks nearing rate cuts while bond markets reprice timing | Lower borrowing costs may be possible, but the timing and pace remain uncertain. | Avoid relying on a single interest-rate outcome when assessing income and interest-rate-sensitive holdings. |
| Resilient labour market | Consumer spending and company profits may remain supported, though lower borrowing costs could be delayed. | Consider the balance between assets that benefit from continued economic strength and exposure to higher rates. |
| Softer growth | Inflation may ease, but cyclical businesses and risk assets may face greater pressure. | Check whether holdings have sufficient diversification and balance-sheet quality for weaker economic conditions. |
| Elections, trade policy, energy prices and geopolitical events | Developments outside an investor’s home market can affect currencies, markets and portfolios. | Review whether global exposures continue to match the intended purpose of the portfolio. |
An investor’s investment monitoring routine for 2027
For an investor, a sound monitoring routine should create perspective, not a reason to react to every headline. In 2027, the volume of available data will be greater than ever, while the useful signals will still be relatively simple: whether an investment continues to do what it was bought to do, whether income remains dependable, and whether the wider market outlook has materially changed.
At Steady Income, I favour a fixed rhythm over constant checking. Review your portfolio monthly for practical matters such as dividends, interest payments, valuation changes and any company-specific news. Once a quarter, step back further. Compare results with your original investment case, assess concentration by sector and geography, and consider whether changes in inflation, rates or currency markets affect the income you expect.
An annual review is the moment to make larger decisions. Revisit your goals, time horizon and appetite for risk before adjusting allocations. That distinction matters: a weak market week rarely justifies a portfolio overhaul, but a changed financial objective might. Keep a short written record of why you own each position and the conditions under which you would sell. It turns investing from a stream of opinions into a disciplined process, with data in its proper place: informing judgement rather than replacing it.
Disciplined monitoring routine
- Review monthly for dividend and interest payments, valuation movements, and material company-specific news.
- Check whether each holding still performs the role it had when originally purchased.
- Conduct quarterly reviews of sector, geographic, and individual-position concentration.
- Assess whether inflation, interest rates, or currency changes affect expected portfolio income.
- Compare quarterly performance and developments against each investment’s original written case.
- Use the annual review to revisit goals, time horizon, risk tolerance, and target allocations.
- Record why you own every position and define the conditions that would justify selling.
Frequently asked questions
What market indicators should investors watch heading into 2027?
Key indicators include inflation trends, labor-market data, Federal Reserve expectations, real and Treasury yields, corporate earnings revisions, credit spreads, lending conditions, equity valuations, and market breadth. Looking at them together offers a clearer view of economic growth, financial conditions, and market risk.
Why do real yields matter for stocks and bonds?
Real yields reflect the return investors expect after inflation. Rising real yields can pressure growth stocks, longer-duration bonds, and highly indebted companies by increasing the effective cost of capital. Falling real yields can support valuations, although declines driven by recession concerns may signal economic weakness.
What does a steepening yield curve mean for investors?
A steepening curve means the gap between long- and short-term Treasury yields is widening. If long yields rise, markets may be concerned about inflation, government borrowing, or bond-market risk. If short yields fall, investors may be anticipating Federal Reserve rate cuts and easier policy.
How do credit spreads signal market risk?
Credit spreads show the additional yield corporate borrowers pay over comparable government bonds. Narrow spreads often indicate confidence in corporate finances, while rapidly widening spreads can point to growing default concerns, tighter lending, and reduced appetite for risk assets.
Why are earnings revisions more useful than headline revenue growth?
Earnings revisions show whether analysts believe future profits are improving or deteriorating. Revenue can increase while margins weaken because of higher wages, financing costs, or input prices. Sustainable earnings and cash generation are generally more important to long-term stock performance than sales growth alone.
What is market breadth and why does it matter?
Market breadth measures how widely gains or losses are shared across stocks, sectors, company sizes, and regions. Broad participation can indicate healthier market leadership. When only a small number of large stocks drive index gains, the market may be more vulnerable to disappointment.
Should investors use these indicators to time the market?
No single indicator reliably predicts short-term market moves. These measures are best used to test an investment thesis, assess portfolio risk, and understand changing conditions. Diversification, investment objectives, time horizon, and tolerance for volatility should remain central to portfolio decisions.