The first time I opened a stock chart, I thought I’d clicked the wrong screen. Green and red bars, colored lines, little numbers along the bottom. It looked like a heart monitor for a patient I knew nothing about.
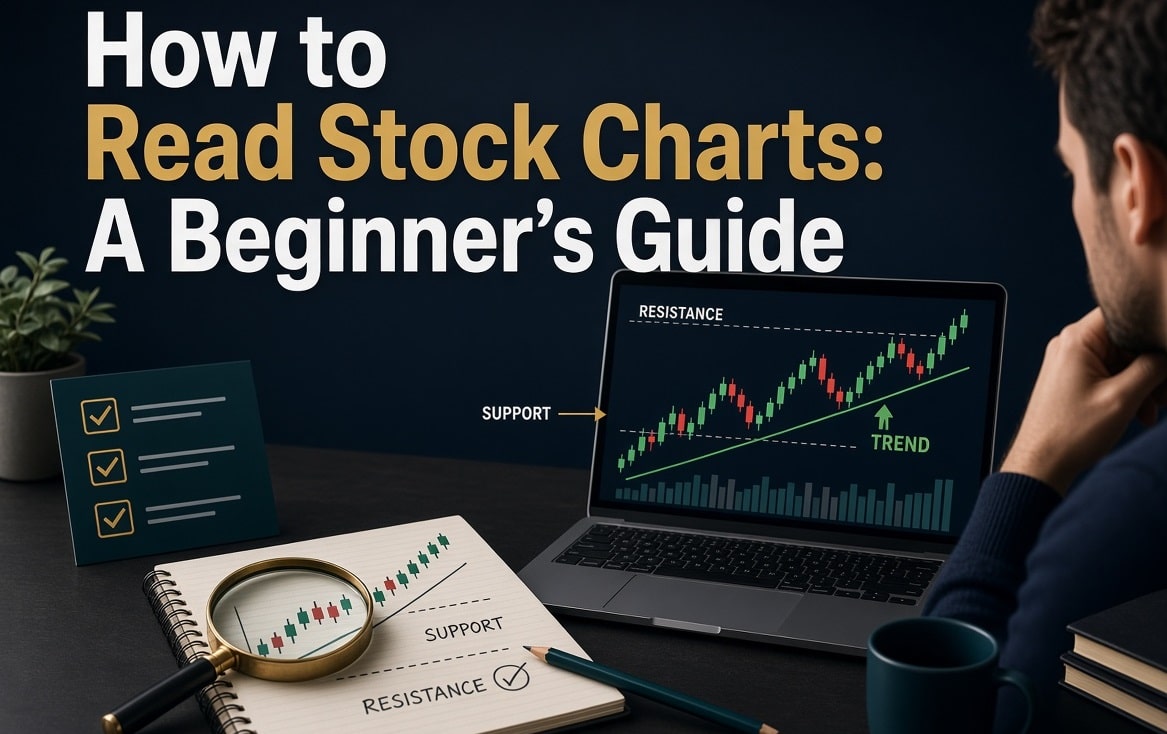
It’s less complicated than it looks. A stock chart answers three questions: where has the price been, how fast did it get there, and how many people were trading along the way. Once you know how to read stock charts at that level, the rest is practice.
This guide covers the parts that matter: chart types, candlesticks, trends, support and resistance, volume, and moving averages. It also answers the questions people search right after, like whether AI can read charts, what the 3-day rule is, and what happens if you sell and rebuy a stock within 30 days.
What a Stock Chart Actually Shows
Every chart has two axes. Price runs up the side. Time runs along the bottom. The line or bars in between are the history of what buyers and sellers agreed on.
When the price rises, buyers are willing to pay more than sellers expected. When it falls, sellers are more eager. That’s all a chart is: a record of that tug of war.
Look for these numbers around the chart, because they give you context:
- Open, high, low, close: the day’s starting price, top, bottom, and final price.
- Volume: how many shares changed hands.
- 52-week high and low: the range over the past year.
- Market cap and P/E ratio: company size, and how much investors pay per dollar of earnings.
Types of Stock Charts
Most platforms let you switch between three views.
| Chart type | What it shows | Best for |
| Line chart | Closing prices connected by a line | Seeing the big picture and the long-term trend |
| Bar (OHLC) chart | Open, high, low, close for each period | Seeing how wide the price range was |
| Candlestick chart | Same four prices, drawn as colored bodies | Reading direction and momentum at a glance |
If you’re brand new, start with a line chart. It strips away noise. Once the trend feels obvious, switch to candlesticks, which most platforms use by default and most traders prefer. Charting tools vary by broker, so if you’re still choosing one, our Robinhood vs. Fidelity comparison is a useful place to start.
How to Read a Candlestick
Each candle covers one time period, like a day or an hour.
- The body is the gap between the open and close. On most platforms, green means the price closed higher than it opened, and red means it closed lower.
- The wicks (shadows) are the thin lines above and below. They show the highest and lowest prices reached.
A few shapes worth knowing:
- Long green body, tiny wicks: buyers controlled the whole session.
- Long lower wick, small body: sellers pushed the price down, then buyers shoved it back up. Often called a hammer.
- Tiny body with wicks on both sides (doji): a stalemate. Neither side won.
- Long upper wick: buyers tried to push higher and got rejected.
Don’t memorize forty candlestick names. Learn these four and focus on what each one says about who was winning that day.
Timeframes: Which One Should You Use?
The same stock looks completely different on a one-minute chart than on a weekly one. Pick the timeframe that matches how long you plan to hold.
- Long-term investors: weekly and monthly charts.
- Beginners: daily charts. They’re detailed enough to be useful and calm enough not to rattle you.
- Day traders: 1-minute to 15-minute charts, always checked against the daily chart for context.
A good habit is to look at the weekly chart first, then the daily, then zoom in only if you need to time an entry. Going top-down keeps you from reacting to noise.
How to Read a Stock Chart Step by Step
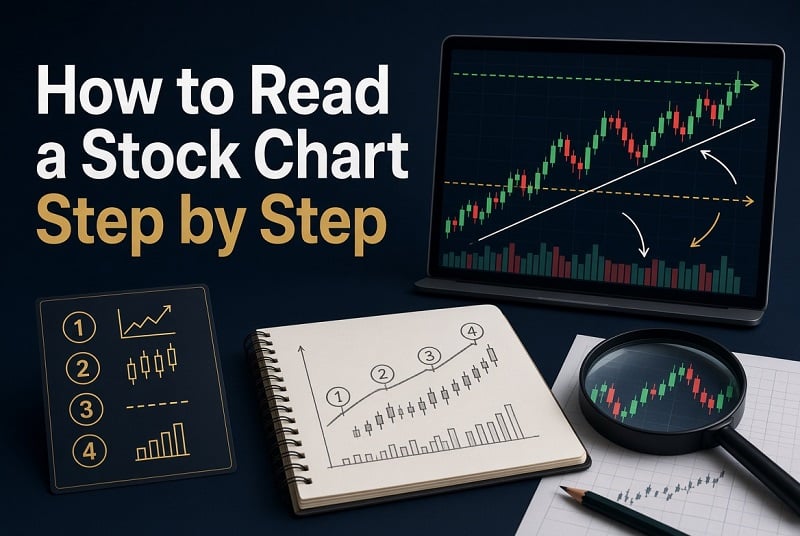
Here’s the routine I’d use on any new chart.
Step 1: Find the trend
Is the price making higher highs and higher lows? That’s an uptrend. Lower highs and lower lows is a downtrend. Bouncing sideways between two levels is a range. Everything else you do on a chart depends on this answer.
Step 2: Mark support and resistance
Support is a price level where buyers keep stepping in and the stock stops falling. Resistance is a level where sellers keep showing up and the stock stalls. Draw horizontal lines where the price has turned around two or more times. When price breaks through resistance, that old ceiling often becomes new support.
Step 3: Check volume
Volume tells you whether a move has real participation behind it. A breakout above resistance on heavy volume is more believable than one on thin volume. A price rise on shrinking volume is a yellow flag.
Step 4: Add one or two moving averages
A moving average smooths price into a single line. The 50-day shows the medium-term trend. The 200-day shows the long-term trend. Price sitting above both is generally healthy. The price below both is a warning. When the 50-day crosses above the 200-day, traders call it a golden cross, and the reverse is a death cross. These are lagging signals, so treat them as confirmation, not a prediction.
Step 5: Use at most one indicator
Two popular ones:
- RSI (relative strength index): a 0-100 reading of momentum. Above 70 is often called overbought, below 30 oversold.
- MACD: compares two moving averages to show momentum shifts.
Pick one. Stacking five indicators usually means five ways to talk yourself into a trade you already wanted.
Step 6: Zoom out and check the news
A chart can’t tell you an earnings report is coming Thursday, or that a company just lost a big customer. Check the calendar and the headlines. Our guide on 7 market indicators investors should watch heading into 2027 covers the wider backdrop worth checking alongside a chart.
A quick worked example
Say a stock called XYZ (a made-up example) has climbed from $40 to $62 over six months. It pulled back to $55 twice and bounced both times, so $55 is support. It keeps stalling near $65, so that’s resistance. Last week it broke above $65 on volume about double the usual, and it’s sitting above its 50-day and 200-day averages.
Read in order: uptrend, support at $55, resistance just broken, volume confirms, long-term trend intact. That doesn’t mean it’ll keep rising. It means the chart is on the buyers’ side right now, and you know where you’d be wrong: a close back below $65, then below $55. That’s the whole point of reading a chart. It gives you levels to act on, not a forecast.
What Is the Most Successful Chart Pattern?
There isn’t a winner that works every time, and anyone claiming one is selling something. That said, a few patterns have a long track record among traders:
- Head and shoulders (a reversal pattern after an uptrend).
- Double bottom (price tests a low twice, then rises).
- Bull flag (a sharp rise, a short pause, then a continuation).
- Cup and handle (a rounded base followed by a small pullback before a breakout).
Even the better patterns fail a meaningful share of the time. Treat any pattern as a setup that needs confirmation from volume and trend, plus a plan for what you’ll do if it fails. A pattern with a stop-loss level beats a “perfect” pattern with no exit plan.
How to Read Stock Charts for Day Trading
Day trading uses the same tools on shorter timeframes, with a few extras:
- VWAP (volume-weighted average price): a line many day traders use as the day’s fair value.
- The 15-minute rule: commonly described as either avoiding trades in the first 15 minutes after the open, when prices swing wildly, or waiting for price to break above or below the high or low of that first 15-minute range before acting.
- Higher timeframes first: check the daily chart before taking a 5-minute setup.
Do you still need $25,000 to day trade?
This changed recently, and many older guides haven’t caught up. In April 2026 the SEC approved FINRA’s amendments to Rule 4210, which removed the pattern day trader designation and the $25,000 minimum equity requirement. The new rules took effect on June 4, 2026, and day trades are no longer counted the way they used to be (FINRA announcement, E*TRADE’s summary of the change).
Brokers are rolling this out on their own schedules, and each can set its own margin policies, so check your broker’s current rules before assuming the old limits are gone. If you’re picking a platform, see our best brokerage for beginners comparison.
If you’re drawn to faster strategies, read the top 5 options trading strategies first. Day trading carries real risk, and most people who try it lose money.
Can AI Read Trading Charts?
Yes, in a narrow sense. Modern AI tools can spot patterns, label support and resistance, and describe what a chart is showing. Some can scan thousands of charts faster than any human.
What they can’t do is see the future. A chart is a record of the past, and AI is working from the same record you are. An AI can say a stock formed a bull flag. It can’t tell you whether a surprise earnings miss lands tomorrow.
Can I use AI to predict stocks?
Use it as a research assistant, not an oracle. It’s good for summarizing filings, screening for stocks that match your criteria, and double-checking your reading of a chart. It’s bad as a source of confident buy and sell calls. If you want to see how people use these tools responsibly, our guides on AI stock picking services and AI stock picks with a small portfolio cover the risks and the sensible limits.
How to Predict If a Stock Will Go Up or Down
Honestly? You can’t, not reliably. What you can do is judge probabilities. A stock in an uptrend, above its 200-day average, breaking resistance on strong volume has better odds than one doing the opposite. Better odds aren’t certain.
Seasonality shows how chart context improves the odds. An analysis published by Advisor Perspectives found that since 1950 the S&P 500 has been positive in September only about 44% of the time. But when the index entered the month above its 200-day moving average, the average September return was about +1.3%, with positive results 60% of the time. When it entered below that line, the average was about -4.2%, positive only 15% of the time. Same month, very different outcome, and the chart told you which version you were likely in.
The 3-Day Rule in Stocks
You’ll see two different things called the “3-day rule.”
- The trading idea. It’s commonly attributed to trader Marty Schwartz, who said big market moves often play out over three days. The practical version: after a sharp drop, wait a few days before buying instead of grabbing the first bounce.
- The settlement rule. This used to mean trades settled three business days later (T+3). US markets moved to T+1 settlement in 2024, so trades now settle the next business day.
Neither is a law of nature. The first is a patience heuristic. The second is plumbing.
What Are the Two Worst Months for Stocks?
September is the clear answer. Historically it has the weakest record of any month for the S&P 500, with that roughly 44% positive rate since 1950. The runner-up changes depending on the period and dataset, with February showing up as soft in some studies, so I wouldn’t build a strategy around naming a second one.
Treat seasonality as a tilt, not a signal. Plenty of Septembers were strong, and selling every August to dodge one weak month would have cost you many good ones. If a correction does hit, our piece on understanding stock market corrections explains what’s normal.
Rules for Buying and Selling After You Read the Chart
This is where most beginner guides stop. It’s also where people make expensive mistakes.
What happens if I sell and buy the same stock within 30 days?
If you sold at a loss and bought the same (or a substantially identical) stock within 30 days before or after, that’s a wash sale. The IRS disallows the loss for that tax year. The loss isn’t gone, though: it gets added to the cost basis of the new shares. This applies across your accounts, including IRAs. If you sold at a gain, the wash sale rule doesn’t apply. Our tax-loss harvesting guide explains how to use losses without tripping it.
Can I sell a stock and buy it again the same day?
Yes. Nothing stops you. Just watch two things: wash sale rules if you sold at a loss, and your broker’s own day trading policies.
How many times a day can I buy and sell the same stock?
There’s no legal cap on trades per day. The real limits are your broker’s rules, margin requirements, trading costs, and taxes. Frequent trading also tends to produce short-term capital gains, which are taxed at ordinary income rates.
What happens if I sell a stock but don’t withdraw the money?
Nothing bad. The cash sits in your brokerage account, and many brokers pay interest on idle cash through a sweep program. The sale still counts as a taxable event that year. Proceeds typically settle the next business day, and you can only withdraw settled cash.
How to sell a stock immediately
Use a market order during regular trading hours. It fills at the best available price right now. The catch is that on thinly traded stocks, the fill can land noticeably below the last price you saw. A limit order lets you name your minimum price but may not fill at all.
How long do you have to hold a stock before selling?
There’s no minimum holding period. Tax is where timing matters.
What happens if I sell a stock after 1 year?
Hold it for more than a year and your gain is long-term, taxed at 0%, 15%, or 20% depending on income. Sell within a year and the gain is short-term, taxed at your ordinary income rate. For 2026, the long-term thresholds (based on taxable income, per Kiplinger’s summary of the IRS figures) are:
| Rate | Single | Married filing jointly |
| 0% | Up to $49,450 | Up to $98,900 |
| 15% | $49,451 to $545,500 | $98,901 to $613,700 |
| 20% | Over $545,500 | Over $613,700 |
Higher earners may also owe the 3.8% Net Investment Income Tax once income passes $200,000 (single) or $250,000 (married filing jointly). Thresholds adjust every year, so confirm on IRS.gov before you sell, and talk to a tax professional about your situation.
If long holds suit you, our guide on the best long-term investments is a good next read, and best short-term investments covers the other end.
What is the best strategy for selling stocks?
The best one is the one you decided on before you bought. Common rules include:
- Thesis broke: the reason you bought no longer holds.
- Price target reached: you set it in advance and you stick to it.
- Stop-loss or trailing stop: you sell if price falls a set percentage or breaks a chart level like support.
- Rebalancing: one position has grown too large for your plan.
- You need the cash: money needed within a few years shouldn’t ride the market.
Is it a good time to sell all my stocks right now?
Nobody knows, and that includes people on TV. Sell because your goals changed, you’re overconcentrated, or you need the money, not because the market feels scary. Moving entirely to cash also means you have to decide when to get back in, and most people get that part wrong.
What Are the Best Stocks to Buy Right Now?
I’m not going to hand you tickers, because a list that’s right today can age badly in weeks. A better approach is to build a filter: strong long-term trend on the chart, healthy earnings, and a business you understand. If you want outside research, see our guides to the best investment newsletters and the Chaikin Power Gauge, which blends chart signals with fundamentals.
Free Stock Chart Cheat Sheet (Copy or Print)
| Signal | What it usually means | What to check next |
| Higher highs and higher lows | Uptrend | Is volume rising on up days? |
| Lower highs and lower lows | Downtrend | Is there a support level nearby? |
| Price bounces off the same level | Support or resistance | Has it held at least twice? |
| Breakout on heavy volume | Stronger signal | Does it hold above the old resistance? |
| Breakout on light volume | Weaker signal | Wait for a retest |
| Price above 50-day and 200-day | Healthy trend | Watch for a pullback to the 50-day |
| RSI above 70 | Possibly overheated | Does the trend still look strong? |
| RSI below 30 | Possibly oversold | Is the business still sound? |
| Long lower wick | Buyers rejected lower prices | Does the next candle confirm? |
| Long upper wick | Sellers rejected higher prices | Does the next candle confirm? |
Mistakes Beginners Make
- Using too many indicators. More lines mean more excuses.
- Reading charts on tiny timeframes. Minute charts are mostly noise.
- Ignoring volume. A move without volume is easy to fake.
- Trading without an exit. Know where you’re wrong before you buy.
- Forgetting the news. Earnings and rate decisions can wreck a clean chart.
- Believing a pattern is a promise. It’s a setup, not a guarantee.
Conclusion
If you remember one thing about how to read stock charts, make it this: charts show you what already happened and where the crowd has been acting. They don’t tell you what happens next. Find the trend, mark support and resistance, confirm with volume, add one moving average, and always know your exit before you enter. Practice on a paper trading account for a few weeks before risking real money.
Frequently Asked Questions
How do you read a stock chart for beginners?
Start with a daily chart. Find the trend (higher highs and higher lows means up), mark support and resistance where price has turned at least twice, check whether volume backs the move, and add a 50-day and a 200-day moving average. Ignore everything else until those four feel natural.
What is the 15-minute rule in trading?
It’s commonly described as avoiding trades in the first 15 minutes after the market opens, when prices swing hard. Some traders instead wait for price to break above or below that first 15-minute range before entering.
Is there a free PDF or free download on how to read stock charts for beginners?
Yes. Use the cheat sheet in this guide: copy it or print it as a one-page reference. Free charting tools from most brokers and sites like TradingView also have built-in tutorials, so you can practice on live charts without paying.
Disclaimer: This article is for educational purposes only and is not financial, investment, legal, or tax advice. Investing involves risk, including the loss of principal. Past performance doesn’t guarantee future results. Tax rules and broker policies change, so verify current details with your broker, the IRS, or a qualified professional before acting.