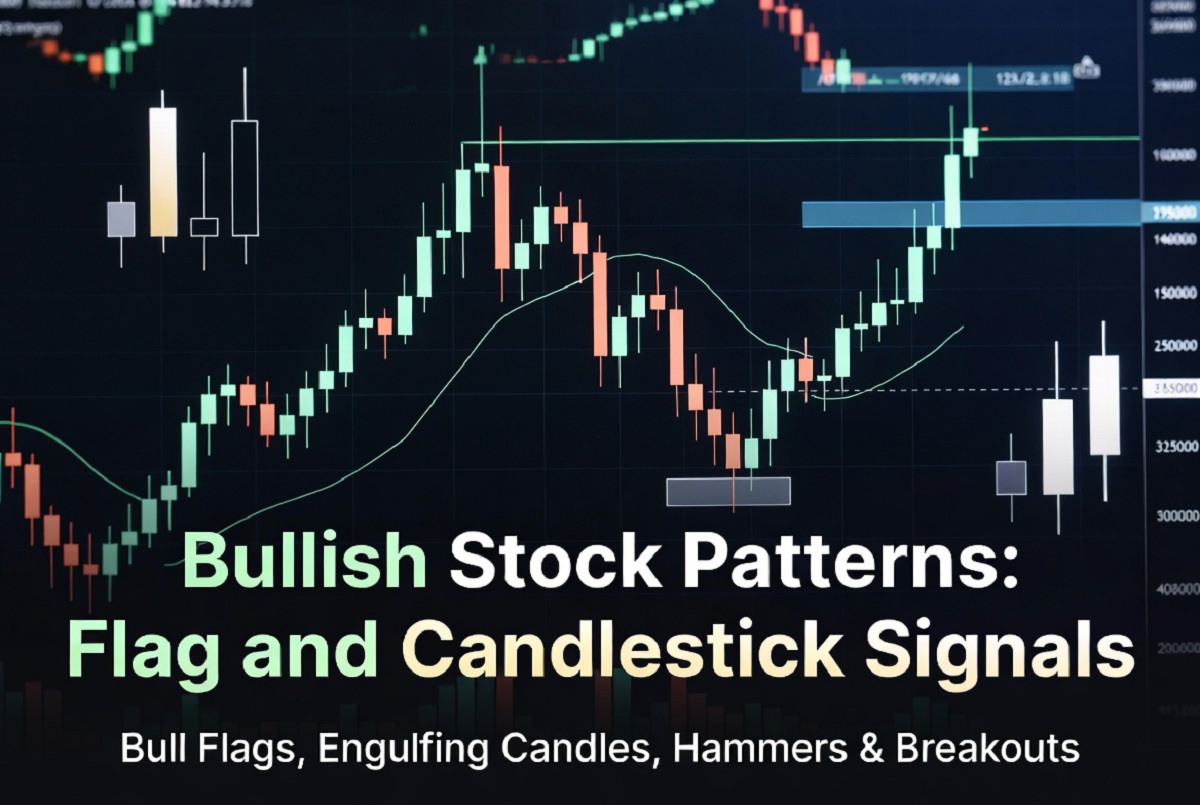
Investing in the stock market requires a keen eye for trends, and recognizing bullish stock patterns can be a game-changer in your trading strategy. Among the plethora of signals, flag and candlestick patterns stand out as potent indicators of potential upward price movements. This guide delves into key bullish candlestick patterns that can help investors make informed decisions. From hammer to engulfing patterns, these signals not only highlight buying opportunities but also empower traders to navigate market shifts with confidence. Discover how mastering these patterns can enhance your trading success and drive smarter investment choices.
Brief Overview
Investing in bullish stock patterns, particularly flags and candlestick signals, can revolutionize your trading strategy by highlighting potential uptrends. By mastering key formations like the bull flag and identifying specific candlestick patterns, traders gain valuable insights into market dynamics. These patterns not only indicate buying opportunities but also empower investors to navigate market shifts confidently. Tailoring entry and exit strategies around these patterns ensures better returns, while understanding their characteristics aids in anticipating market moves. Enhance your trading skills and unlock new potentials by integrating these signals into your investment decisions.
Key Highlights
- Bullish stock patterns indicate potential upward price movements, crucial for informed trading decisions.
- Candlestick patterns visually represent market sentiment, aiding in predicting price reversals or continuations.
- Bullish flag patterns suggest price consolidations before a strong upward trend continues.
- Ascending triangle patterns signal potential breakouts and continued uptrends, providing strategic entry points.
- Trading strategies using bullish patterns require patience, market context understanding, and volume confirmation.
Understanding Bullish Stock Patterns
For any investor eager to capitalize on upward trends, recognizing bullish stock patterns is key. These patterns serve as vital signals for traders, often indicating the likelihood of a stock’s price moving upward. By learning about bullish candlestick patterns and market dynamics, investors can time their trades more effectively, ensuring better returns. Discovering the core characteristics of these patterns, as well as understanding why they’re essential to trading strategies, can significantly aid in spotting trends before they fully develop. Dive into the fundamentals of bullish patterns and what makes them indispensable for any informed investor.
What Are Bullish Stock Patterns?
Bullish stock patterns are specific formations on stock charts that suggest the stock’s price will likely begin an upward trajectory. These patterns are crucial signals for traders, often leading to the identification of a strong uptrend before it becomes evident to the broader market. Among these patterns, bullish candlestick formations stand out. They provide clear visual cues that indicate potential price increases, especially when volume confirms the direction. For instance, when the stock’s price shows a bullish candlestick pattern, it often includes a small body and a long lower wick, signaling that buyers are gaining control even after an initial downside. Such signals are indispensable for traders since they highlight key moments of potential breakout, often after a phase of consolidation.
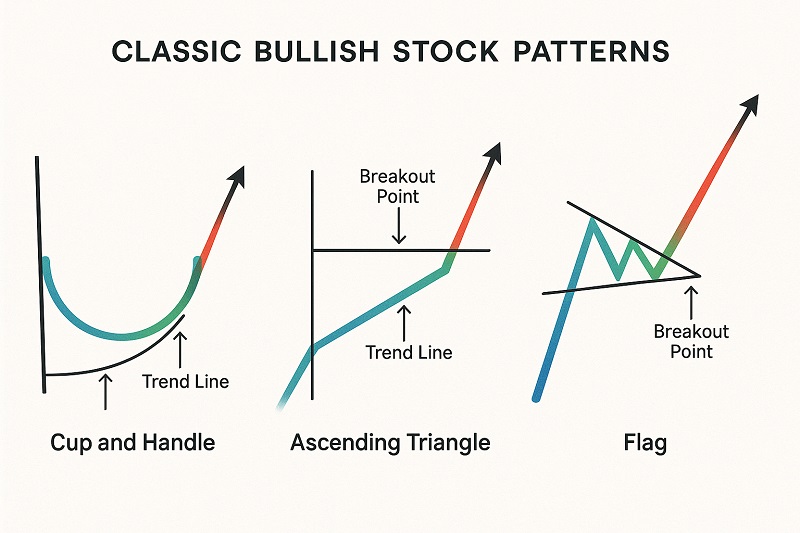
The bull flag pattern is another cornerstone of bullish chart reading. This particular bullish chart pattern that occurs after a sharp price increase suggests a brief consolidation phase followed by a continuation of the upward trend. The pattern resembles a flag on the chart, with the strong rise acting as the ‘flagpole’ and the consolidation zone forming the ‘flag.’ When traders notice a flag pattern, they anticipate a bullish signal as soon as the price breaks out of the flag, hinting at further upside potential. Recognizing these patterns involves a keen eye for detail and understanding the broader market context, including volume changes and potential market catalysts.
Patterns bullish in nature often precede significant market moves, thus playing an essential role in technical analysis strategies. By mastering these patterns, investors can better anticipate market shifts before they happen, allowing them to position themselves advantageously. In particular, traders frequently analyze the wick and body dynamics of candlestick formations to gauge momentum shifts, relying on the collective insights from multiple signals to confirm a bullish outlook. Ultimately, being well-versed in these patterns provides traders with the confidence needed to make timely and informed decisions in an ever-fluctuating stock market.
Key Characteristics of Bullish Patterns
Understanding the key characteristics of bullish patterns can greatly enhance an investor’s capacity to identify opportunities for growth in the stock market. At their core, bullish patterns are often defined by recurring signals that suggest a shift towards a strong uptrend. These signals are not always immediately obvious, requiring discipline and a keen eye for detail. One common trait of bullish candlestick patterns is their reflection of bullish pressure, indicated by an upward price trajectory that might begin with a long lower wick in candlestick charts. This signals that, despite short-term selling, buyers are stepping in to push the price upwards.
A significant aspect of many bullish patterns is their relationship with trading volume. During the formation of these patterns, a decline in volume might occur during consolidation, followed by a surge as the stock’s price breaks out of its consolidation phase, indicating trader confidence. This volume analysis provides a robust confirmation signal for investors, suggesting that the upward movement has the strength needed to sustain itself.
Another hallmark of bullish patterns is the appearance of continuation patterns, which signal the potential for the existing trend to persist. These patterns, such as the ascending triangle or the wedge pattern, occur when a stock consolidates, forming a recognizable shape that indicates a future breakout. Traders often monitor these shapes closely, as the eventual breakout can typify a significant upward movement. During these scenarios, it’s critical to watch for bullish signals, such as increased volume and tighter consolidation patterns, which confirm future upward trends.
In terms of practical application, identifying these patterns enables investors to make strategic decisions, optimizing entry and exit points to maximize profitability. Investors often anticipate the continuation of a trend when they notice a bullish pattern forming, leveraging this insight to time their trades effectively. Being able to discern the subtle signals within these patterns requires experience and knowledge, which is why continuous learning and practice are essential for any serious stock market participant. As investors become more adept at recognizing these patterns, they can enjoy the dual benefits of increased insight and improved trading results, all while staying attuned to the market’s ever-evolving nature.
Exploring Candlestick Patterns
Candlestick patterns are one of the most effective tools for investors seeking to decode market movements. Understanding these patterns allows traders to interpret potential reversals and identify key moments for entering or exiting trades. By exploring various bullish candlestick patterns, traders can gain insights into future price actions and make better-informed trading decisions. This section delves into the foundations of candlestick charting and dives deep into interpreting these signals to enhance trading strategies.
Introduction to Candlestick Patterns
For anyone looking to navigate the complexities of the stock market, candlestick patterns play a crucial role in providing insights into potential price movements. Originating from Japan, these patterns have been utilized for centuries to track price actions, offering visual representations of market sentiment. Each candlestick, with its body and shadows, tells a story about the price movement within a specific timeframe. Understanding candlestick patterns involves recognizing formations that can signal potential upward trends or reversals. It’s essential for traders to grasp the basics of both individual candles and complex patterns to leverage technical analysis effectively. Technical analysis, by examining these candlestick patterns, aims to forecast future price movements based on historical data.
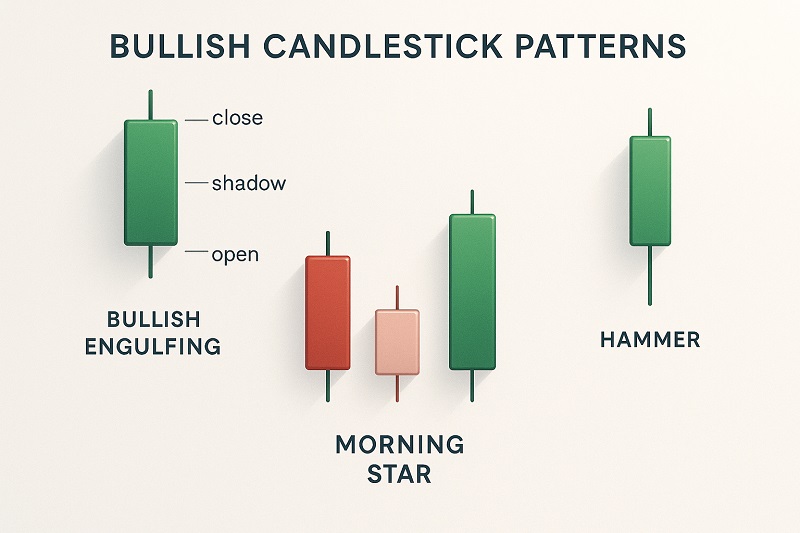
One popular bullish pattern is the bullish engulfing pattern, which is formed when a smaller bearish candle is followed by a larger bullish candle, signifying potential upward momentum. This pattern suggests that buyers have effectively taken control, leading to an anticipated uptrend. Traders often look for confirmations such as increased volume to validate the bullish signals presented by the pattern. In technical analysis, these patterns help investors identify consolidation periods followed by breakout opportunities. Breakouts usually occur when a price surpasses a resistance level, indicating a strong bullish signal and potential for further upward movement.
The beauty of candlestick patterns lies in their ability to provide traders with quick visual cues that convey intricate market dynamics. By observing the candlestick patterns and understanding what each part represents – such as the upper and lower shadows or wicks – traders can gain a deeper understanding of market psychology. For instance, a long lower shadow might indicate that sellers drove prices down significantly, but buyers managed to regain control, suggesting bullish pressure. Recognizing such dynamics in candlestick patterns can help traders anticipate future price movements and adjust their strategies accordingly. This understanding is fundamental when aiming to capitalize on market trends and invest wisely. By embracing the intricacies of candlestick patterns, investors can significantly enhance their market analysis capabilities and timing in trades.
How to Interpret Bullish Candlestick Patterns
Deciphering bullish candlestick patterns for potential profit involves more than spot-checking for specific formations. It’s about understanding the broader context in which these patterns form, as well as the psychology driving the market participants. A prime example is the bullish engulfing pattern, a key signal suggesting a shift from bearish to bullish sentiment. This pattern typically forms at the end of a downtrend and indicates a reversal when confirmed with increased trading volume. Traders must analyze the candlestick’s size, shape, and position to fully comprehend its implications on market direction.
The significance of candlestick patterns extends beyond mere visual observation, it’s an integral part of the strategic toolkit for seasoned traders and investors. Effective interpretation involves looking for supporting signals, such as breakout volumes or previous consolidation phases that provide a backdrop for a potential movement. The body of the candlestick is crucial; a larger body often emphasizes stronger conviction among traders, whereas shadows can indicate resistance or support levels being tested. When traders observe a bullish candle with a long body, following consolidation and confirmed by volume increments, they perceive it as a strong buy signal under the guidance of technical analysis.
Contextual analysis plays a vital role in interpreting these patterns correctly. For instance, the appearance of bullish candlestick patterns amidst an uptrend can indicate the continuation of the current trend, reinforcing a trader’s confidence in potential gains. Conversely, if these patterns emerge after a rapid decline, they suggest a potential reversal, encouraging traders to act swiftly to enter positions before prices escalate.
Incorporating bullish candlestick patterns into one’s investing strategy requires patience, attention to detail, and the readiness to integrate additional analytical tools. For example, pairing candlestick analysis with relative strength indices (RSI) or moving averages can provide a comprehensive view of overall market conditions, helping to filter out false signals. Traders should also remain adaptive, as market dynamics are continuously evolving and patterns can vary in reliability based on diverse factors, like the stock’s liquidity or broader economic indicators.
Ultimately, mastering the art of interpreting these patterns empowers traders to seize opportunities efficiently, ensuring they are well-positioned to capitalize on upward movements. This nuanced understanding underscores the critical role of bullish candlestick patterns in an effective trading Arsenal and assists investors in making accurate forecasting and informed decisions in the volatile environment of stock trading.
Recognizing Specific Bullish Candlestick Patterns
For investors navigating the fast-paced world of stocks, understanding specific bullish candlestick patterns is crucial. These visual cues on stock charts are significant in predicting upward movements, suggesting when a stock’s price will begin an ascent. This knowledge helps traders to strategically position themselves for potential rewards. By exploring the significance of candlestick patterns, we can identify bullish signals in them, providing essential insights for any aspiring investor. With the right analysis, these patterns become a part of a trader’s arsenal, guiding decisions and enhancing confidence in a volatile market environment.
The Significance of Bullish Candlestick Patterns
Recognizing the significance of bullish candlestick patterns could be the difference between a profit and a loss in the trading world. As an investor, it’s essential to understand what these patterns represent and how they signal potential reversals or continuations. Typical bullish candlestick patterns, like the bullish engulfing pattern, signal potential reversals at the end of a downtrend, indicating that buyers have overtaken sellers and a stock’s price will likely begin an upward climb. This knowledge enables traders to anticipate market movements, capitalizing on the potential for gains as the stock price ascends.
Bullish patterns don’t just arise in isolation; they often accompany volume changes that confirm trend direction. When a bullish candlestick pattern emerges with increased volume, it signals robust trader confidence, reinforcing the potential for a breakout. For example, a bullish engulfing pattern is formed when a bearish candle is followed by a larger bullish candle, showing traders that the market sentiment has turned positive. In this scenario, the candlestick’s body indicates the strength of the move; a substantial body signifies a strong conviction among traders, a crucial element that analysis should focus on.
Moreover, the significance of these candlestick patterns also depends on their placement within the broader chart context. Patterns such as the morning star or hammer suggest a shift in momentum, where buying pressure overrides a recent downward trajectory. Understanding these pivotal moments offers strategic entry points, allowing investors to position themselves right before a potential breakout.
These patterns align with other technical analysis tools, establishing a comprehensive strategy to evaluate stock behavior. By integrating candlestick insights with indicators like moving averages or the Relative Strength Index, traders enhance the signal’s reliability, filtering out potential false alarms that might arise in an isolated pattern. By mastering the significance of candlestick patterns, marketers can confidently manage risks and strategically maneuver within the ups and downs of the stock market.
Identifying Bullish Signals in Candlestick Patterns
Identifying bullish signals within candlestick patterns is a pivotal competency for any investor looking to maximize their gains in the stock market. Bullish candlestick patterns suggest that the stock’s price is poised for an upward move, a signal that traders should not overlook. Among these patterns, the bullish engulfing pattern stands as a staple, where the bullish signal is amplified when the pattern is accompanied by a surge in trading volume, confirming that the bulls are indeed in control.
Recognizing these signals requires attention to detail and an understanding of what each part of the candlestick represents. For instance, the candlestick’s body reflects the core sentiment during the trading session, a long body may signify a solid uptrend, indicating that the stock’s price will likely begin escalating. Meanwhile, the presence of a wick or shadow hints at volatility, showing price rejections at certain levels, and helping traders pinpoint resistance and support zones.
Traders often enhance their analysis by examining the broader chart context, looking at how these patterns fit within existing trends. When a bullish candlestick pattern emerges amid clear uptrends, it signals continuity and strength. Yet, if seen after prolonged downtrends, these patterns highlight potential reversals, alerting traders to the opportunity to gain entry before the broader market recognizes the shift. To further validate these signals, traders may corroborate them with other indicators like Bollinger Bands or MACD, ensuring a robust analytical framework that minimizes speculative risks.
Moreover, it is crucial for traders to consider the phase of market sentiment when reading these patterns. In volatile markets, signals from individual bullish candlestick patterns might require additional confirmation beyond mere visual assessment, contextual elements like concurrent economic news or earnings reports play a role in confirming or discrediting the signal’s viability. For risk-averse investors, waiting for confirmation through follow-up patterns can help in making decisive yet cautious investment moves.
Ultimately, identifying bullish signals within candlestick patterns is not just about recognizing shapes on a chart; it’s about interpreting the underlying market psychology and sentiment shifts that these patterns betray. By cultivating this skill set, traders are better equipped to time their trades effectively, aligning their positions with momentum rather than against it, and positioning themselves for maximum profitability in the dynamic sphere of stock trading. This fundamental understanding enhances an investor’s toolkit, paving the way for smarter and more informed trading decisions, reducing uncertainty and leveraging potential stock market gains.
The Bullish Flag Pattern Explained
Diving into the dynamics of bullish patterns, one finds the bullish flag pattern , a reliable continuation pattern that traders adore. This pattern hints at the persistence of a bullish trend post-consolidation. It can serve as an early signal for investors wishing to capitalize on imminent breakouts. We’ll tackle how to spot a bullish flag in stock charts and discuss its crucial importance for traders navigating a market poised for upward moves. By understanding this pattern, you unlock a strategic advantage, combining visual analysis and market signals to ride a strong uptrend effectively.
Spotting a Bullish Flag in Stock Charts
Spotting a bull flag pattern early on can be immensely rewarding for investors, as it signifies a pause in the market before a continuation of a strong uptrend. The bullish flag pattern is characterized by an initial steep price increase, forming the ‘flagpole.’ Following this surge, a consolidation occurs in a parallel channel or slight downward slant. This forms the ‘flag’ component of the pattern. The key to identifying this bullish pattern accurately lies in recognizing both the rapid rise and the subsequent consolidation phase where the price doesn’t retrace more than 50% of the pole’s length.
For traders, signals to watch for include volume analysis. Typically, during the consolidation (the flag), you should observe a drop in volume. Once the price breaks out of the flag shape, expect a volume surge, confirming the breakout as genuine and signaling the market’s renewed enthusiasm. This volume spike reassures traders that the stock is not just moving due to random fluctuations but that it has genuine upward momentum, supported by market participants.
A notable feature is the breakout, as this defines the bullish flag’s completion. When the stock’s price breaks upward out of the flag, confirmed by increased volume and perhaps even additional bullish candlestick patterns, it hints at the resumption of the previous strong uptrend. At this critical juncture, technical analysts often look at the broader market context for confirmation. The breakout usually breaches short-term resistance, propelling the stock into new trading heights.
Technical traders often depend on these visual cues, using other analytical tools such as trend lines, moving averages, and the relative strength index (RSI) to filter out false signals in volatile markets. The reliability of this pattern makes it a staple for investors seeking to time their entry and manage risks based on solid data rather than speculation. Additionally, recognizing these flags across multiple timeframes enhances the strategic outlook, catering to both intraday and long-term investment strategies. As patterns bullish, like the bullish flag, underscore potential market opportunities, the adept investor can stay ahead, leveraging these insights to secure notable returns in an ever-evolving marketplace.
Now that we’ve identified the bullish flag pattern, here are some additional tips for effective chart analysis.
- Consider the trading volume; a strong breakout with increasing volume confirms the pattern.
- Analyze the trend angle; a steep flagpole suggests powerful momentum.
- Look for consolidation; flags often exhibit tight, sideways price movement.
- Watch for pattern duration; shorter flags tend to lead to stronger breakouts.
- Identify support and resistance levels; they help determine entry and exit points.
- Use moving averages; they can validate trend direction and strength.
- Confirm with oscillators; RSI and MACD can signal overbought or oversold conditions.
- Monitor broader market trends; they can influence individual stock movements.
Applying these tips can equip you with the confidence and clarity needed for well-informed investment decisions.
Why the Bullish Flag Pattern is Important for Traders
For traders, the bullish flag pattern is not just another tool in technical analysis; it’s a vital signal drawing attention to market dynamics indicative of potential gains. The importance of recognizing this pattern lies in its predictive quality during a strong uptrend. It symbolizes a temporary price consolidation, hinting that this pause might precede a strong continuation of the upward move. This is crucial for traders aiming to optimize entries and maximize profits.
One can’t overstate the value of understanding why a bullish flag pattern forms. Following a sharp ascent, the market may pause as investors consolidate gains or reassess positions, leading to a flag formation. Instead of viewing this as a market weakness, experienced traders see it as a healthy interruption before the next buying opportunity. During the flag formation, volume generally decreases, indicating a lack of strong selling pressure. Skilled investors know to watch for a volume increase when the price attempts to break out from this pattern, using it as a confirmation signal of returning bullish momentum.
Moreover, the bullish flag serves as an essential part of continuation patterns, reinforcing the idea of staying with the trend rather than prematurely exiting positions. The pattern alerts traders that despite short-term pauses, the market trend remains robust. To exploit this effectively, traders often combine real-time chart analysis with candlestick data, validating breakout scenarios using multiple indicators.
Tighter stop-loss levels commonly accompany these trades to manage potential risks while allowing room for the pattern to fully play out.
Investor psychology also plays a role in the bullish flag’s importance. Seeing this pattern emerge reassures traders that others share their market sentiment, fostering confidence in collective decision-making. This psychological boost, reinforced by data, helps traders maintain their positions, reducing the risk of reactionary errors in volatile phases.
Adopting the bullish flag pattern involves a blend of strategy, patience, and understanding market context. Traders who master identifying and acting upon such patterns not only improve their trading strategies but also sharpen their foresight into market behaviors, enhancing their likelihood of success. Effectively leveraging this pattern means traders not only follow strategic plans but also gain a comprehensive understanding of market cycles. As the pattern symbolizes continued upward movement, traders convert theoretical analysis into actionable insights, seizing opportunities as they unfold, thus ensuring profitable trade execution and positioning themselves for future market advances.
Analyzing the Ascending Triangle Pattern
When exploring bullish stock patterns, the ascending triangle pattern stands out as a reliable signal for continuation in a strong uptrend. This pattern is favored among traders due to its clear indications of market sentiment and potential breakout points. As a bullish chart pattern, the ascending triangle typically forms during price consolidation and suggests an inevitable upward price movement once the stock’s price breaks through the resistance barrier. Understanding this pattern allows investors to plan strategic entries, maximize gains, and solidify their position in the market.
Trading Strategies Using the Ascending Triangle Pattern
Trading the ascending triangle pattern involves recognizing the unique characteristics that define it and leveraging these for profitable trades. The pattern is identified by a flat resistance line at the top and an upward sloping support line at the bottom, which forms a distinct triangle shape. During the pattern’s formation, traders often observe a period of consolidation where the stock price bounces between the support and resistance lines. This consolidation provides critical insights, as the reduced volatility typically coincides with decreased volume, reflecting market participants’ hesitation until the breakout occurs.
Investors must maintain vigilance during the pattern’s build-up to spot potential breakout signals. A breakout is often accompanied by a surge in volume, confirming the strong uptrend and increasing traders’ confidence that the stock’s price will likely begin its upward trajectory. Utilizing volume as a corroborative indicator minimizes the risk of false breakouts, which could lead to premature or incorrect trading decisions.
When the price breaks above the horizontal resistance line with increased volume, traders typically view it as a bullish pattern, signaling a strong buying opportunity. Given the ascending triangle’s nature as a continuation pattern, it’s generally wise to trade in the direction of the breakout, capitalizing on the momentum that follows. The breakout can dramatically shift the stock’s price movement, and traders should set clear targets and strategies to manage their positions effectively.
Calculating the potential target price from an ascending triangle breakout involves assessing the pattern’s height, measured from the initial resistance line to the upward sloping support. By applying this height to the breakout level, traders can estimate potential future price points, allowing them to optimize their entry and exit strategies strategically.
Moreover, combining these insights with candlestick patterns further enhances the trading strategy. The alignment of bullish signals, such as bullish candlestick formations amidst a breakout, amplifies the buy signal strength. Volume analysis during these formations fosters a comprehensive perspective, confirming that the breakout isn’t merely speculative but rooted in genuine market sentiment.
To mitigate potential losses and optimize trading outcomes, employing stop-loss orders is crucial. These must be placed just below the breakout point or the last support level to protect against undetermined shifts in market dynamics. This strategic cushion offers reassurance, allowing investors to remain committed to their strategies during volatile market conditions.
Ultimately, integrating the ascending triangle pattern into one’s trading toolkit requires a meticulous understanding of its implications and the broader market context. As traders discern patterns bullish to exploit within stock charts, the ability to identify and act on these insights positions them for increased profits and strategic market longevity. Encouragingly, by honing skills in recognizing and trading these patterns, investors bolster their confidence and edge above others in an ever-competitive trading environment.
Harnessing the power of bullish candlestick patterns can transform your trading strategy, sharpening your ability to anticipate market moves with confidence. From the classic hammer to the dynamic engulfing pattern, each signal offers unique insights into potential upward trends. As an investor, leveraging these patterns not only enhances your market predictions but also increases your chance of capitalizing on bullish opportunities. Solidify your expertise by downloading our comprehensive guide, and stay ahead in your trading journey by turning these key patterns into profitable decisions.
FAQ: Bullish Stock Patterns: Flag and Candlestick Signals
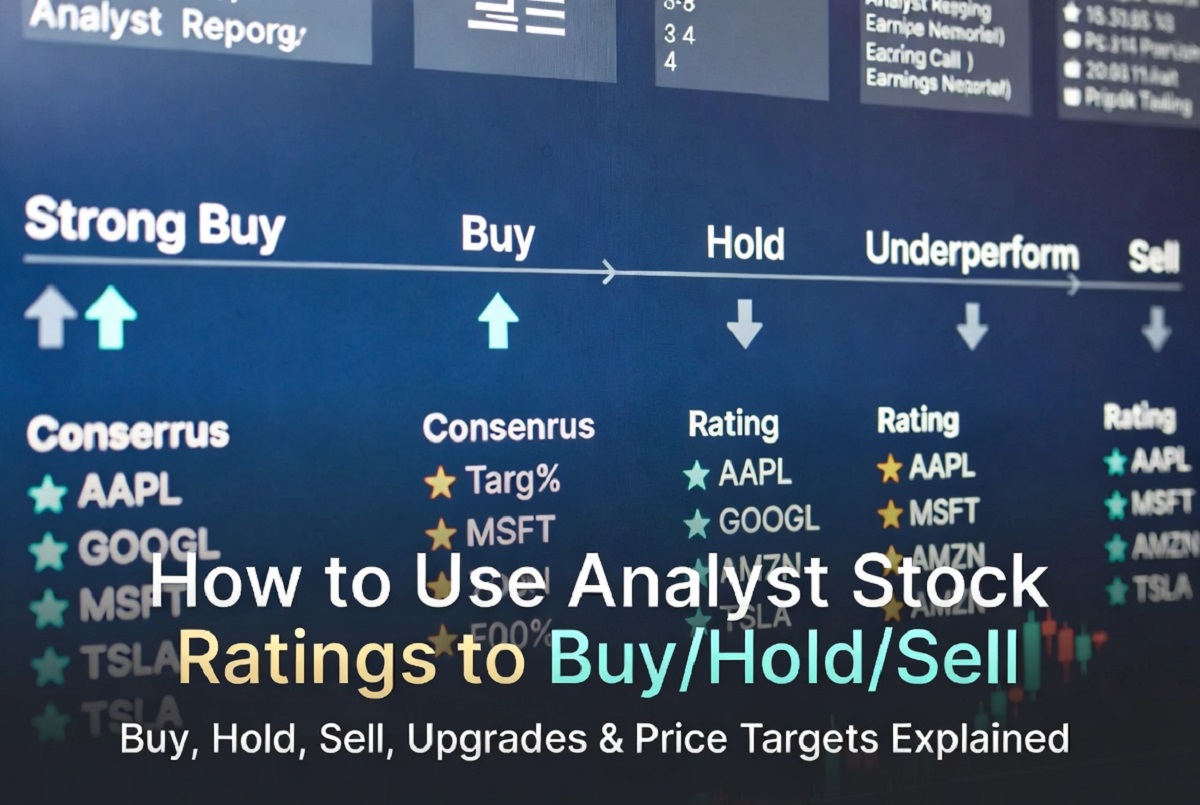
What are bullish stock patterns and why are they important for investors?
Bullish stock patterns are formations on stock charts indicating that a stock’s price is likely to begin an upward trajectory. Recognizing these patterns is crucial for investors as they highlight potential buying opportunities and help navigate market shifts confidently.
How do candlestick patterns help traders make informed decisions?
Candlestick patterns visually represent market sentiment and help predict price reversals or continuations. By learning and identifying these patterns, traders can gain insights into future market movements and make better-informed trading decisions.
What is a bull flag pattern and how can traders use it?
The bull flag pattern is a bullish continuation pattern that occurs after a sharp price increase, indicating a brief consolidation phase followed by an upward continuation. Traders use it to predict further upward potential, waiting for volume confirmation on the breakout.
Why is the ascending triangle pattern significant for stock traders?
The ascending triangle pattern is a bullish signal indicating potential breakouts and continued uptrends. Recognizing this pattern offers strategic entry points, helping traders capitalize on the momentum during price breakouts.
How can mastering candlestick patterns enhance trading success?
Mastering candlestick patterns sharpens a trader’s ability to anticipate market moves, providing confidence in decision-making. Recognizing patterns like hammer or engulfing may offer insights into potential upward trends, leading to better trade timing and profitable decisions.