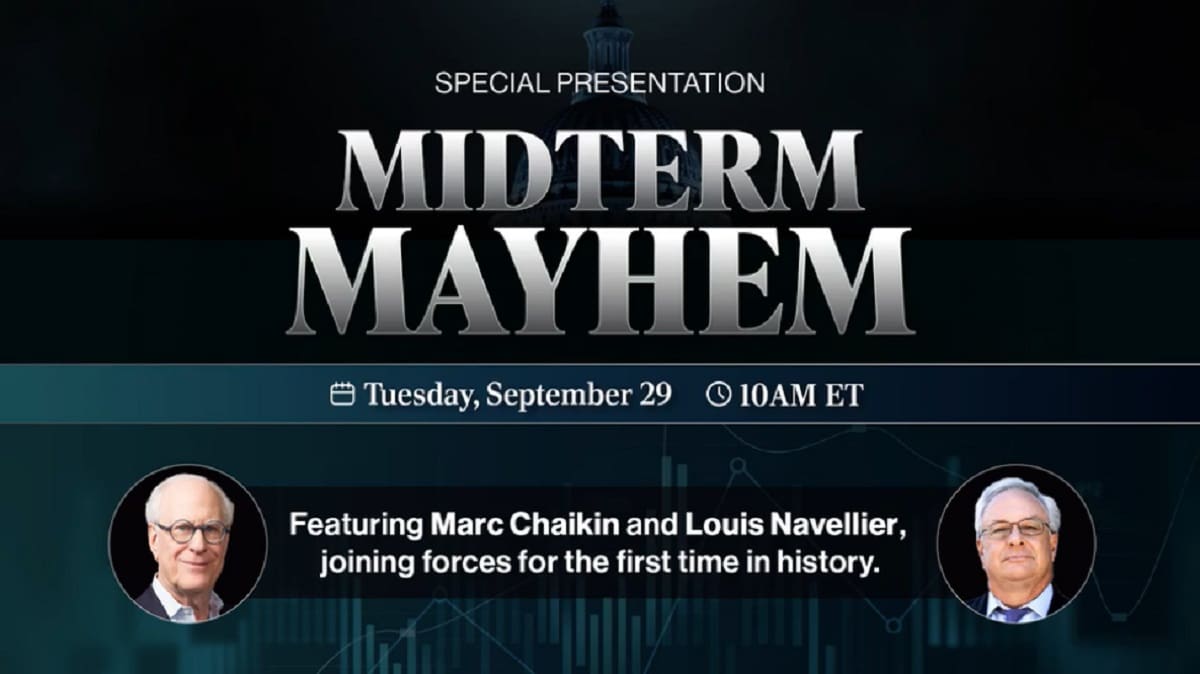
On Tuesday, September 29, at 10 a.m. Eastern Time, two of the most closely followed investors of the last forty years will sit down together for the first time. Louis Navellier and Marc Chaikin are hosting a free live event they call Midterm Mayhem. Their message is direct: an unusual market event with a 92 percent historical track record going back to 1925 is likely to start affecting U.S. stocks in the early days of October, weeks before the November 3 midterms.
They say the pattern shows up regardless of which party gains or loses seats. It is not about politics. It is about what more than a hundred years of market data keep repeating around midterm election years. Both men believe their separate research systems are now flashing the same signal. During the broadcast they plan to name the exact date they expect the move to begin, explain why it matters, and hand out four free stock recommendations—two they currently like and two they think investors should avoid or sell.
The event costs nothing. You reserve a seat by entering your email. Once you do, you also get access to a private website loaded with tools and daily updates meant to help you look at your own holdings before the live session. Louis and Marc keep repeating the same point: the window between September 29 and the expected early-October start is short. What you do with that window, they argue, could decide whether the final months of 2026 feel like relief or regret.
Two Careers That Rarely Overlap
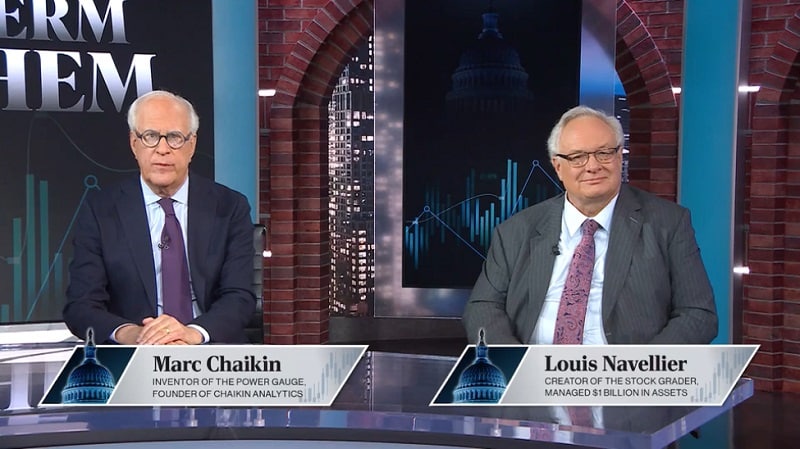
Marc Chaikin has spent nearly sixty years on Wall Street. He worked with or for Paul Tudor Jones, George Soros, Steve Cohen, and Michael Steinhardt. He built a technical indicator that still sits inside every Bloomberg and Reuters terminal and is used by hundreds of banks, brokerages, and hedge funds. The Nasdaq hired him to create three indexes. His research product once beat both Morningstar and Bloomberg for top honors in a given year. He is referenced in the standard literature on technical trading.
His Power Gauge system takes twenty separate factors that professional traders have long watched—money flow, trend quality, and other signals that do not jump out from a simple price chart—and turns them into a single rating. Chaikin has used that framework to flag the 2020 and 2022 sell-offs and the 2023 bank-run episode. In one well-remembered CNBC segment he warned that Priceline.com was about to break; the stock did so within a day and the host later acknowledged the call on air. His work has appeared in Barron’s, Forbes, Bloomberg, Fox Business, and MarketWatch. One of his market notes drew more than eleven million views. More than a million people in 148 countries now follow his analysis.
A personal story often comes up when people ask why he bothers with retail investors. After 2008 his wife’s 401(k) was cut in half by a money manager who was supposed to protect it. That experience pushed him to put institutional-grade tools into the hands of ordinary people so they would not have to outsource every decision.
Louis Navellier built his firm far from Wall Street, in the Sierra Nevada mountains. At its peak the firm managed about a billion dollars. Over the decades that followed, his approaches are described as nearly tripling the S&P 500 in certain stretches, outperforming Warren Buffett by some measures, and ranking second out of four hundred managers in one USA Today survey. Forbes called him the king of quants. The New York Times called him an icon among growth investors. Barron’s ranked him among the most successful fund managers and newsletter editors in the country. He has rung the opening bell at the New York Stock Exchange and been a regular presence in Barron’s, Forbes, The Wall Street Journal, Investor’s Business Daily, CNBC, and Bloomberg.
His Stock Grader assigns every stock a letter grade from A to F based on quantitative factors. A long backtest running from 1998 shows that the A-graded names in the system outperformed the S&P 500 by more than 1,300 percent, while the F-graded names lagged badly. Early recommendations that later became household names include Nike before an 88,655 percent rise, Microsoft before 60,860 percent, Adobe before 37,722 percent, and Nvidia spotted as far back as August 5, 2005, ahead of a nearly 10,000 percent advance. During the COVID period the same system highlighted Moderna, Novavax, and Vaxart before their largest moves. His firm once posted fourteen straight years without a negative return and produced a Wall Street Journal–ranked mutual fund plus a Morningstar–topped ETF portfolio.
Both men are credited with calling the major turns of the last four decades: Black Monday in 1987, the dot-com bust, the 2008 financial crisis, the 2020 COVID crash and the rally that followed, the 2022 bear market, the 2023 regional-bank stress, and the AI-driven advance that came after.
What makes September 29 unusual is that these two independent systems—one quantitative and fundamental, the other multi-factor and technical—have arrived at the same conclusion about the weeks ahead. That is the reason they are sharing a stage for the first time.

The Pattern That Keeps Showing Up Around Midterms
The core of the presentation is a claim about market behavior in midterm election years. According to Navellier and Chaikin, an unusual shift has appeared with a 92 percent frequency when the data are examined back to 1925. The pattern does not care which party wins or loses. It has shown up across very different political and economic backdrops for more than a century.
They believe the current signals point to the early days of October as the start of the ripple effects. That leaves only a short stretch of time between the September 29 broadcast and the expected onset. Viewers will hear the exact date the two men have circled, the reasons their systems flagged it independently, and why they describe the coming stretch as a perfect storm not seen in more than thirty years.
The long historical window is deliberate. By going back before the modern Federal Reserve, the postwar boom, the inflation of the 1970s, the tech bubble, the financial crisis, and the pandemic, the speakers are trying to show that the pattern is not tied to any single regime. Markets are still probabilistic. Nothing is certain until it happens. The case they are making rests on the consistency of the historical record plus the real-time readings in both the Stock Grader and the Power Gauge. The live event is where they plan to walk through the charts and the reasoning in full.
Four Free Recommendations and the Tools That Come With Registration
Signing up is free and takes only an email address. In return you receive access to a private website that contains background material, system access, and preparatory tools. The centerpiece of the live broadcast is four stock recommendations delivered on camera—two names the pair currently favor and two they believe investors should avoid or exit. Those four picks are presented as immediate positioning tools ahead of the expected October move.
They also plan to outline a broader approach they believe can help participants aim for returns that are multiples of ordinary market performance. The language in the materials speaks of potential 2x to 6x improvements relative to unprepared portfolios and of the possibility of doubling, tripling, or even quadrupling capital in the weeks that follow for those on the right side of the shift. The exact steps will be explained live. The repeated message is that the difference between meaningful gains and meaningful losses may come down to decisions made in the days right around the event.
A limited-time version of Navellier’s Stock Grader is already available to anyone who registers. It is sometimes called the Mayhem Monitor. You type in a ticker and receive a letter grade from A to F. A-graded stocks are described as the highest quality and historically linked to the strongest subsequent performance. F-graded stocks are flagged as the weakest and candidates for sale or avoidance.
Registrants get a small daily allotment of free searches—three per day is the number mentioned—leading up to September 29. The system draws on data covering more than six thousand stocks. The annual cost of collecting that data is cited at $300,000. Some institutional clients have paid tens of thousands of dollars for similar access. Here it is offered at no charge as preparation for the event.
Daily lists are also part of the package. Daily Downgrades show stocks that have just moved to D or F grades—names that may be entering or already in downtrends. Daily Upgrades highlight stocks newly raised to B or A grades—names that may be setting up for strength. The first of those upgrade lists is scheduled to appear on the private site closer to the event. Registration activates the upgrade stream.
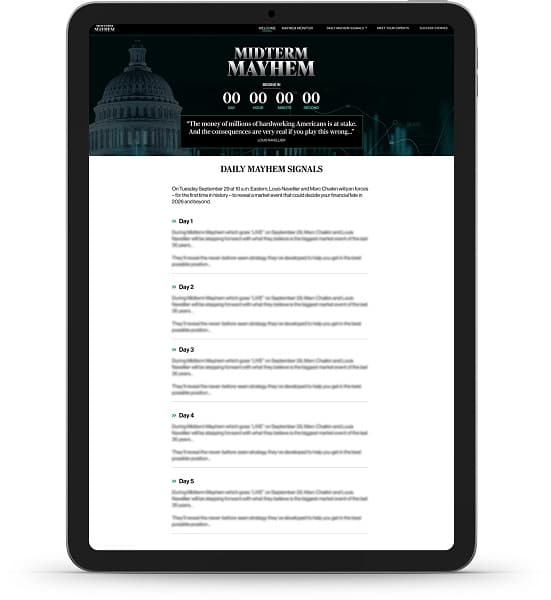
These tools let you run your existing holdings through the same quantitative screen Navellier uses and give a concrete illustration of the process both men apply when they identify risk and opportunity around major turns. No tool or single recommendation replaces personal due diligence, an honest look at risk tolerance, or professional advice where it is needed. The combination of free access, daily updates, and the live four-stock reveal is still presented as an unusually complete package for an event that costs nothing.
What the Records Actually Look Like
Louis Navellier’s quantitative work is credited with identifying the 1987 crash, the technology-bubble peak, and the 2008 crisis ahead of time. During the COVID sell-off the same system highlighted vaccine developers before regulatory approvals and before the largest percentage moves in those names. In the AI cycle that accelerated around 2023, the system is said to have recognized key semiconductor and software companies years earlier. The long-term backtest of A-graded stocks versus the broader market is offered as statistical support across multiple regimes.
Marc Chaikin’s Power Gauge is described as having issued bullish ratings on at least seven of the top ten performing stocks every year since 2016. In 2022—one of the worst years for equities since 2008—the system still identified ten of that year’s top performers while warning against technology exposure ahead of a roughly 28 percent drop in the Nasdaq. Specific sell recommendations issued that year are referenced as having helped subscribers avoid further damage. Chaikin’s institutional background and the widespread use of his indicator give the framework weight with both professional and individual audiences.
Together the two are presented as having alerted followers to virtually every major market dislocation of the past four decades. The current midterm setup is described as ranking among the most consequential signals either has seen in thirty-five years. That claim is what turns the September 29 broadcast from a routine webinar into something the organizers treat as potentially decisive for portfolios.
The Private Site and the Days Leading Up to the Broadcast
Once you register you land on a private microsite built to bring people up to speed before the live event. It contains fuller biographies of both experts, expanded explanations of their systems, and the interactive Stock Grader. The site also carries the Daily Downgrades and the Daily Upgrades once those lists go live.
The free tool access is limited in time. After September 29 the complimentary window may close. The practical suggestion is that the most useful work happens in the days before the broadcast, when you can still adjust positions based on grades and signals before the expected October move begins.
Only a Handful of Days Separate the Broadcast from the Expected Start
The event is September 29. The expected start of the market effects is the early days of October. That is a short stretch. Attendees are told they will leave the session knowing the exact date the two men have marked, the reasoning behind it, and the portfolio steps they recommend.
Because the event is free and the only requirement is an email address, the barrier is low. Signing up also opts you into marketing emails from InvestorPlace, with the ability to unsubscribe at any time. The private website and tool access open immediately, giving you days to run tickers through the Stock Grader, review the daily lists, and arrive at the live session prepared.
Two Different Methods Reaching the Same Conclusion
Independent systems landing on the same outlook is uncommon. When those systems belong to investors with multi-decade public records of navigating both crashes and long bull markets, the agreement draws attention. Navellier’s quantitative grading and Chaikin’s multi-factor Power Gauge approach the market from different directions. Their shared view on the midterm pattern, the October timing, and the need to position now is the reason for the joint appearance.
The fact that the historical pattern is bipartisan further separates the forecast from political noise. It is not a bet on election results. It is a bet on calendar-driven market behavior that has repeated across very different political and economic environments for a century. That framing may matter to investors who prefer process and data over party narratives.
What to Do If You Decide to Participate
Go to the registration page for Midterm Mayhem and enter an email address to reserve a free seat.
After confirmation, open the private website and start using the limited free Stock Grader searches. Run your current holdings and any names you are considering.
Watch the Daily Downgrades and, once they appear, the Daily Upgrades. Put Tuesday, September 29, 2026, at 10 a.m. Eastern on your calendar and plan to watch live.
During the broadcast note the four specific recommendations, the exact October date that is highlighted, and the broader positioning framework. After the session, look at your portfolio again in light of the new information, your own risk tolerance, your time horizon, and any professional advice you use.
The Bottom Line
Markets move between stretches of relative calm and stretches of rapid change. The case for Midterm Mayhem rests on the claim that one of those change periods is approaching on a schedule supported by more than a hundred years of data and currently confirmed by two independent, long-tenured research systems. Whether that claim proves accurate will be known only later. What is clear today is that two highly credentialed investors are making the case publicly, together, for the first time, and are offering free access to their reasoning, their tools, and four specific stock ideas.
If you have money in U.S. equities, the cost of listening is an hour of time and an email address. The potential cost of missing a correctly timed warning or opportunity, according to the experts, could show up in years of portfolio results. That difference is the reason they keep asking people to claim a free seat.
Louis Navellier and Marc Chaikin take the stage on September 29 at 10 a.m. ET. They will walk through the 92 percent historical precedent, the expected early-October start, the bipartisan character of the pattern, and the concrete steps they believe investors should take now. Four free recommendations will be delivered live. Supporting tools are already available to anyone who registers. The stretch of time left to prepare is short.
Reserve the free seat, look at the preparatory material, and decide for yourself whether this is the market moment the two veterans believe it to be. The decision, and the positioning that follows, will be yours.