In the fast-evolving world of financial markets, where trillions of dollars change hands daily and algorithms already dominate institutional trading, a new innovation from TradeSmith stands out as potentially transformative for retail investors. On April 15, 2026, TradeSmith announced the opening of a final beta version of its groundbreaking new technology ahead of a special live event scheduled for Wednesday, April 22, at 10 a.m. Eastern Time.
This event, dubbed the AI Signals Trading Event, promises to introduce attendees to Behavioral Profile Analysis (BPA) — a sophisticated application of artificial intelligence that moves beyond traditional fundamental or technical analysis. Instead of applying one-size-fits-all frameworks to every stock, BPA builds individualized “behavioral profiles” for more than 2,467 stocks, identifying unique patterns and “tells” that historically precede significant price moves with remarkable accuracy.
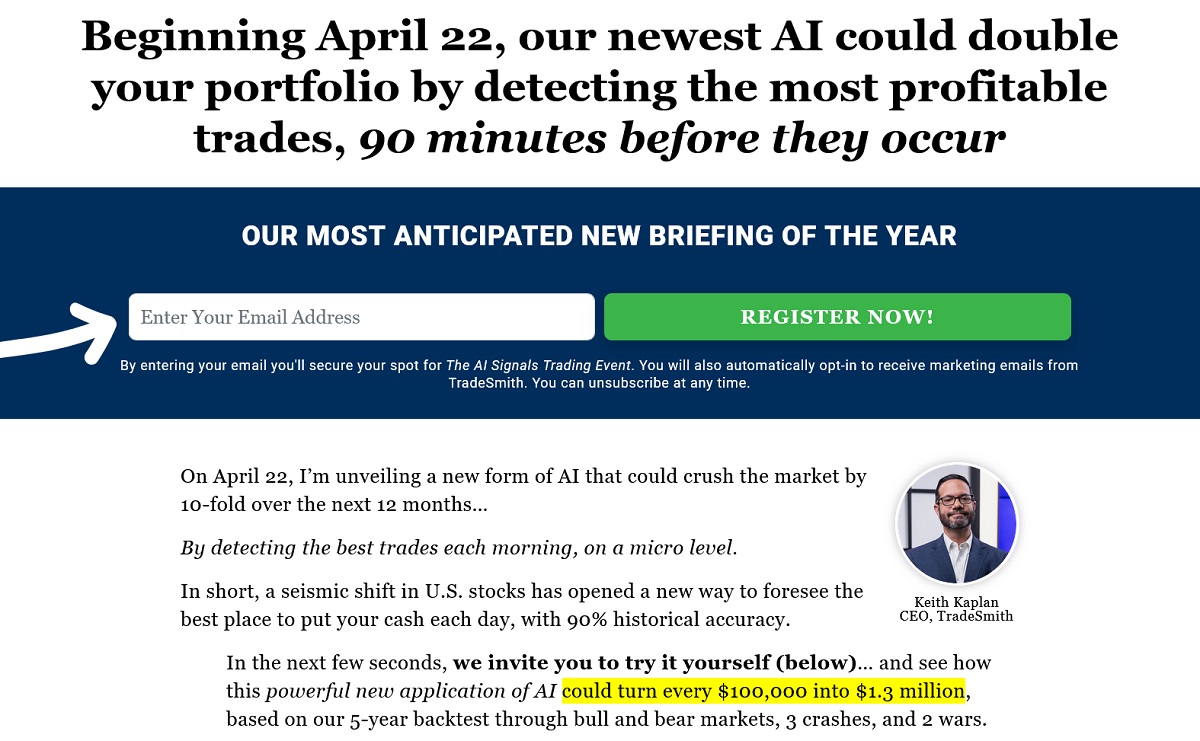
TradeSmith, a fintech company with over 21 years of experience developing data-driven investing tools, has invested more than a year and millions of dollars into this system. The company’s CEO, Keith Kaplan, a veteran software architect with more than 25 years in the industry, will lead the presentation. Kaplan has built a reputation for creating accessible, powerful platforms that help everyday investors navigate complex markets.
The AI Signals Trading Event Replay is Live
This morning, Keith Kaplan, launched the most advanced trading tool in TradeSmith’s 21-year history.
8,946 people showed up to watch him introduce Signals by TradeSmith – new AI-powered trading system that’s been more than 12 months in the making.
He revealed how it completely reframes how you think about trading and making money in the markets. Then he demoed it onscreen, showing how it scans 2,467 stocks each morning and surfaces the day’s highest-probability setups more than 90 minutes before the market opens.
He also shared two free recommendations as a thank-you for attending: the No. 1 stock to buy right now – along with an options trade designed to amplify the gain – and the No. 1 stock to avoid.
If you missed it, the full replay is available for a limited time. Make sure to check it out.
Understanding Traditional Analysis – and Its Limitations
To appreciate what makes Behavioral Profile Analysis different, it helps to revisit the two dominant approaches to stock selection that investors have relied on for decades.
Fundamental analysis, popularized by legends like Warren Buffett, focuses on a company’s intrinsic value. Analysts examine financial statements, earnings growth, competitive advantages (moats), management quality, and macroeconomic factors to determine whether a stock is undervalued or overvalued. This method has produced outstanding long-term results for patient investors, but it assumes companies can be evaluated through a relatively uniform lens. In reality, two firms in different sectors — say, a software giant like Oracle (ORCL) and an energy producer like Chevron (CVX) — respond to the same economic news in vastly different ways.
Technical analysis, on the other hand, studies price charts, volume, moving averages, oscillators like the Relative Strength Index (RSI), and patterns such as head-and-shoulders or flags. It operates on the premise that price action reflects all known information and that history tends to rhyme. While effective for timing entries and exits, traditional technical tools often apply the same indicators indiscriminately across thousands of securities, ignoring the unique “personality” each stock develops over time.
Both methods work — sometimes exceptionally well — but they share a common shortcoming: they treat stocks more like interchangeable assets than distinct entities with their own habits, quirks, and predictable responses to specific conditions.
TradeSmith’s team recognized this gap. After more than a year of development, they created a system that asks a fundamentally different question: How does this specific stock behave, and when do its unique behavioral patterns signal an impending big move?
This shift in perspective forms the core of Behavioral Profile Analysis.
What Is Behavioral Profile Analysis (BPA)?
At its heart, BPA draws an analogy from fields far removed from finance — sports coaching and criminal profiling. New England Patriots coach Bill Belichick famously built detailed behavioral profiles of opposing quarterbacks, studying not just obvious tendencies but granular details: performance in cold weather, on different playing surfaces, or under specific referee crews. Similarly, FBI profilers analyze patterns in behavior to predict future actions.
Stocks, the TradeSmith team argues, exhibit analogous “personalities.” Each ticker develops its own thumbprint — a set of recurring conditions under which it tends to make outsized moves. These patterns emerge from a complex interplay of price action, volume, volatility, calendar effects, sector dynamics, and even seemingly unrelated external data points.
The AI system scans approximately 2,467 stocks and evaluates millions of potential trade combinations daily — some reports mention up to 10.4 million evaluations each morning. It identifies the precise alignment of factors that have historically preceded strong gains (or, in bearish setups, declines) for that individual security.
Unlike generic screeners, BPA creates a custom behavioral profile for each stock. The AI then monitors real-time data to detect when current conditions match the high-probability setups embedded in that profile.
Early backtesting results shared by TradeSmith are striking. In a one-year backtest, the strategy reportedly outperformed the S&P 500 by a factor of three. Individual signals have shown historical accuracy rates of 86% to 95% or higher, with average holding periods ranging from a few days to several weeks.
Importantly, the system is designed with “signal decay” in mind — the tendency for edges to disappear once too many participants exploit them. Drawing inspiration from quant giants like Renaissance Technologies, the platform continuously monitors performance and can retire fading signals.
Ready to explore this for yourself?
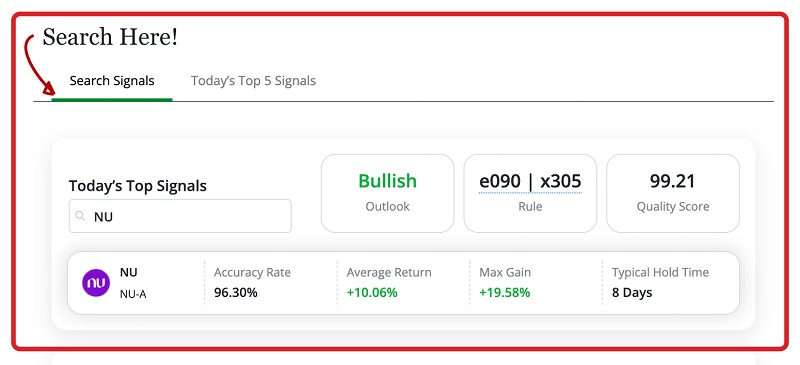
Register for the free AI Signals Trading Event on April 22 and receive instant beta access. You’ll be able to input any ticker from the covered universe and see projected profit potential, expected duration, and historical success rates before committing capital.
Real-World Examples: How BPA Identifies Setups
TradeSmith has shared several illustrative cases to demonstrate the system in action.
Consider Invesco (IVZ), a major asset manager. The signal triggered when two specific indicators aligned: the stock’s Bollinger Percent B and Money Flow Index both exceeded 80. These measures capture where price sits relative to its recent range and the direction of money flow, respectively. No human analyst would likely combine these exact thresholds for IVZ specifically. When the conditions lined up, the stock delivered an 18.8% gain in 11 days.
For Lam Research (LRCX), a key semiconductor equipment supplier, the pattern was even more idiosyncratic: the stock needed to close above its 200-day moving average exactly two trading days before a market holiday. On August 28, 2025 — two days before Labor Day — the signal fired, resulting in an 11.4% gain in 15 days with an 86% historical accuracy rate for that setup.
In a live internal beta test conducted in January and February 2026, Equifax (EFX) showed a signal when the stock closed down four consecutive days while market volatility rose above its 10-day average. The outcome: a 15.2% gain in seven days backed by a 91% historical win rate.
The system extends beyond stocks to options strategies, where leveraged returns can amplify results. Examples from backtests and prototypes include:
- Caterpillar (CAT): 126% in 72 hours
- Nvidia (NVDA): 129% in 5 days
- Lockheed Martin (LMT): 365% in 30 days
- HCA Healthcare (HCA): 461% in 13 days
- Generac (GNRC): 1,082% in 33 days
These are not guarantees of future performance, of course — past results do not predict future outcomes, and trading involves substantial risk of loss. But they illustrate the potential power of identifying hyper-specific, stock-tailored setups that most investors would never spot manually.
Another compelling example involved Advanced Micro Devices (AMD). The signal combined low Bollinger bandwidth, RSI dropping below 30, and strong sales of the video game Starfield. Historically, this unusual trio aligned with a 95% probability of a rally. When it triggered in the beta test on January 12, 2026, AMD rose 8.1% in 48 hours — potentially boosted to 121% with options.
Even more unconventional combinations have appeared, such as linking Netflix (NFLX) price candles and volatility to viewership numbers for the show Squid Game, yielding a 15.5% stock gain (or 104% boosted) in 24 hours.
The AI treats the market like a massive Rubik’s Cube, aligning sometimes “bizarre” factors that no human brain could systematically evaluate across thousands of securities every day.
The Technology Behind the System
TradeSmith’s development team, including a chief developer who is a Chartered Market Technician (CMT) with decades of experience managing mutual funds and high-net-worth accounts, has engineered the platform to process enormous datasets rapidly.
Each day, the system:
- Builds or updates behavioral profiles for the entire universe of covered stocks.
- Evaluates millions of potential factor combinations.
- Identifies alignments that match historically profitable patterns for each ticker.
- Outputs actionable insights, including estimated profit potential, typical trade duration, and success probability.
- Highlights the top five “perfect trades” that refresh every morning.
Users can type any ticker into the interface and instantly see tailored signals. The platform also includes a “boost” feature for options, allowing users to explore leveraged versions of the underlying stock moves.
This represents the culmination of TradeSmith’s 21-year evolution. The company has long focused on quantitative tools that remove emotion from investing, and BPA builds on that foundation by incorporating modern AI capabilities to detect micro-level patterns invisible to traditional methods.
Kaplan has described it as hedge-fund-level research now made accessible to retail investors. The inspiration partly traces to quantitative pioneers who employed large teams of PhDs in mathematics, physics, and even string theory to uncover non-obvious correlations — including, legendarily, links between stock prices and weather patterns in distant cities.

In today’s data-rich environment, where information updates by the second and trillions of data points flow daily, such pattern recognition has become feasible at scale.
Performance in Different Market Conditions
One of the most frequently highlighted strengths of the BPA system is its adaptability across market regimes.
Backtests reportedly show solid performance through bull markets, bear markets, and crashes. In 2022 — a challenging year for many investors — a model portfolio using the signals allegedly crushed the broader market. During the 2025 volatility (including what TradeSmith refers to as the “tariff crash”), the system continued to identify opportunities on both the long and short sides.
The 2020 COVID period, the 2008–2009 financial crisis window, and the 2023–2024 recovery are also cited as environments where the approach added value by either capturing upside or keeping investors sidelined during downturns.
In the current “rocky” market of 2026, TradeSmith suggests conditions may be particularly favorable. Volatility and shifting sentiment can create more frequent mispricings and behavioral anomalies for the AI to exploit.
A key narrative from the announcement is that traditional “buy-and-hold” may become “dead money” for periods of up to 12 months amid an anticipated deeper sell-off — an “echo of the late ‘90s” or a once-in-30-years event that Kaplan plans to detail during the April 22 event. In such an environment, the ability to identify short-term, high-probability setups on both sides of the market could prove especially valuable.
Of course, no system is infallible. Markets can remain irrational longer than expected, black swan events occur, and even high historical accuracy rates (90%+) still mean occasional losses. Proper risk management, position sizing, and diversification remain essential. The promotional materials emphasize that the system provides probabilities and projections, not certainties.
Keith Kaplan and TradeSmith’s Track Record
Keith Kaplan brings a unique blend of technical expertise and investor advocacy to the role. With a background as a software architect, he has spent years building tools specifically designed to level the playing field for retail traders who lack the resources of large institutions.
TradeSmith itself serves a global community, with tools used to monitor and analyze significant assets under influence. The company has appeared in major financial media and focuses on quantitative, emotion-free approaches.
Kaplan’s presentations often combine big-picture market warnings with specific, actionable ideas. In this event, he is expected to deliver:
- An urgent new market prediction and warning
- A live demonstration of the AI Signals system
- Details on why short-term, AI-driven trading may outperform conventional strategies in 2026
- Three free recommendations (described as valuable given past free picks, such as one that reportedly rose 94% in 25 days)
- Insights into how the system works even during crashes
Attendees will also receive a 3-part video series in advance to prepare, covering:
- Detecting profitable trades 90 minutes (or more) before they fully develop.
- An inside look at the AI technology.
- Why the strategy can perform well in downturns.
Additionally, a special report naming two stocks aligned with the system (updating daily) is offered as a free incentive for early registrants.

Why This Matters for Today’s Investors
The broader investment landscape has changed dramatically. Retail participation has surged, information flows faster than ever, and institutional algorithms execute trades in microseconds. In this environment, traditional long-term buy-and-hold — while still valid for many — faces challenges from increased volatility and structural shifts.
Short-term trading, when approached systematically rather than emotionally, offers an alternative or complement. BPA aims to make that systematic approach more accessible by automating the discovery of edge that would otherwise require immense computational power and data science expertise.
By focusing on each stock’s unique behavioral profile rather than generic indicators, the system seeks to uncover opportunities that remain hidden from most screeners and chart readers.
For investors frustrated with prolonged sideways or down markets, or those seeking to supplement core holdings with tactical trades, the tool presents an intriguing option. The low time commitment — potentially just 10 minutes a week to review top signals — makes it practical even for busy professionals.
Preparing for the April 22 Event
The AI Signals Trading Event is positioned as a pivotal moment in TradeSmith’s history — the unveiling of what they call the most advanced analytical platform in the firm’s 21-year existence.
To make the most of it:
- Register immediately for free access to the final beta version. You can begin testing the system on any of the 2,467 covered stocks right away.
- Watch the preparatory video series to understand the concepts before the live broadcast.
- Arrive early on April 22 (recommend logging in 15 minutes before 10 a.m. ET) to test your connection.
- Have note-taking materials ready for the live demo, market outlook, and specific trade ideas.
- Consider the free special report on two stocks flagged by the system.
Registration is straightforward and carries no obligation. You will receive marketing communications from TradeSmith, but these can be unsubscribed from at any time.
The event itself will include a live demo, Kaplan’s market briefing, explanations of the technology, performance context across market cycles, and actionable takeaways — including free recommendations.
Risks, Realities, and Responsible Use
While the potential rewards are highlighted enthusiastically, it is crucial to approach any trading system with realism. Historical backtests and accuracy rates are educational but do not guarantee future results. Slippage, commissions, liquidity issues, and changing market dynamics can all impact real-world performance.
Options trading, in particular, carries amplified risks due to leverage and time decay. Not every signal will succeed, and even a 90%+ historical win rate implies periodic losses that must be managed.
TradeSmith emphasizes that the system is a tool to support decision-making, not a substitute for personal judgment or professional advice. Investors should consider their risk tolerance, financial situation, and objectives before acting on any signals.
The materials also note that edges can erode over time as more participants adopt similar strategies — hence the importance of ongoing monitoring and the platform’s built-in decay detection.
Looking Ahead: The Future of AI in Retail Trading
If successful, Behavioral Profile Analysis could represent a meaningful step toward democratizing advanced quantitative techniques. What was once the exclusive domain of hedge funds with teams of PhDs and multimillion-dollar infrastructure may become available to individual investors through intuitive interfaces.
TradeSmith positions this as potentially “the biggest disruption to retail investing since the rise of online trading 30 years ago.” Whether or not that ambitious claim fully materializes, the underlying idea — treating each stock as a unique behavioral entity rather than a generic asset — offers a fresh lens through which to view markets.
In an era of abundant data and powerful computing, the ability to detect micro-level patterns tailored to individual securities could become increasingly valuable. For those willing to engage actively with short-term opportunities, tools like this may open new pathways to portfolio growth even when broad indices stagnate.
Conclusion: Claim Your Free Spot Today
The AI Signals Trading Event on April 22, 2026, offers a rare opportunity to preview TradeSmith’s latest innovation before its wider release. By registering now, you gain immediate access to the beta platform, allowing you to explore Behavioral Profile Analysis on thousands of stocks at no cost.
You’ll see for yourself how the system generates tailored signals, complete with probability estimates, projected gains, and durations. You’ll also position yourself to hear Keith Kaplan’s latest market insights and urgent warning — potentially one of the most significant briefings TradeSmith has delivered in recent years.
Whether you are an experienced short-term trader looking for a new edge, a long-term investor seeking tactical overlays, or simply curious about the next evolution of AI in finance, the event and beta access provide a low-risk way to evaluate the technology.
Markets are dynamic, and new tools continually emerge. The question for each investor is whether they want to explore innovations like BPA early or wait until they become mainstream.
Don’t miss this chance. Secure your free spot for the AI Signals Trading Event and start testing the beta system today. Registration takes just moments, and the potential insights could prove valuable in navigating whatever lies ahead in 2026 and beyond.
To register and claim your immediate beta access, visit the official TradeSmith registration page here. Spots are open to daily readers and interested investors, but acting sooner ensures you can begin exploring the platform well before the live event.
This development reflects the ongoing integration of artificial intelligence into personal finance — not as a replacement for human judgment, but as a powerful assistant capable of processing vast datasets and uncovering patterns beyond manual analysis. In that sense, the April 22 event may be more than just another webinar; it could mark an important moment in the accessibility of sophisticated trading intelligence.