Navigating the thrilling world of options trading requires a solid grasp of implied volatility. This dynamic metric not only forecasts the potential fluctuations of an asset but also heavily influences an option’s premium. For investors eager to make informed decisions, understanding implied volatility is paramount. This guide unveils a straightforward approach to calculating it quickly, while shedding light on the profound impact of accurate calculations. Dive in to discover how mastering implied volatility can elevate your trading strategy, offering practical insights that enhance your trading performance and lead to more strategic, informed investment decisions.
Brief Overview
Navigating the thrilling world of options trading requires a solid grasp of implied volatility. This dynamic metric not only forecasts the potential fluctuations of an asset but also heavily influences an option’s premium. For investors eager to make informed decisions, understanding implied volatility is paramount. This guide unveils a straightforward approach to calculating it quickly, while shedding light on the profound impact of accurate calculations. Dive in to discover how mastering implied volatility can elevate your trading strategy, offering practical insights that enhance your trading performance and lead to more strategic, informed investment decisions.
Key Highlights
- Implied volatility forecasts potential asset price fluctuations and influences option premiums significantly.
- High implied volatility results in expensive options due to expected higher returns or losses.
- Comparing historical and implied volatility aids in understanding market trends and investor sentiment.
- Key factors like market sentiment, expiration time, and interest rates impact implied volatility.
- Mastering implied volatility equips investors with a competitive edge in the options market.
Understanding Implied Volatility
Implied volatility serves as an essential tool for investors in the dynamic world of options trading. It quantifies the market’s expectations of future volatility, affecting both the pricing and the perceived risk of options. By exploring what implied volatility is and how it operates, investors can better position themselves for strategic decision-making. This knowledge is particularly useful when dealing with complex models like Black-Scholes, where implied volatility helps predict option prices. Let’s dive deeper into its definition and operational mechanics to appreciate its significance fully.
What Is Implied Volatility?
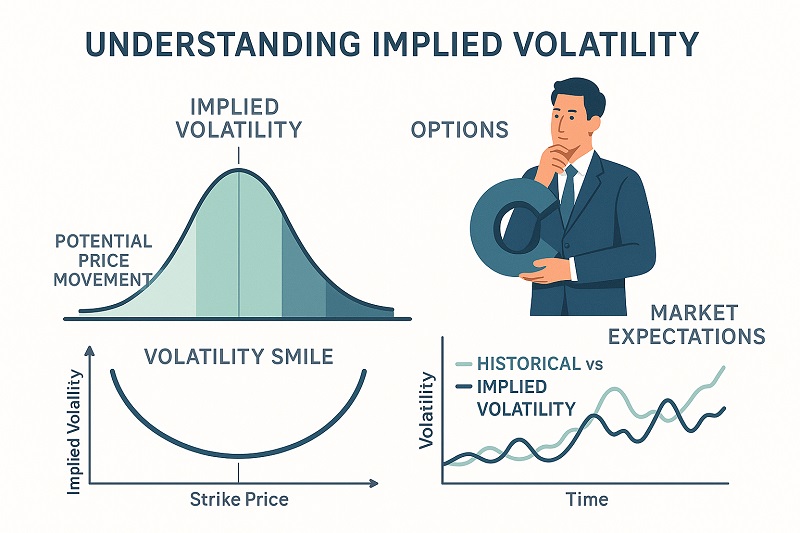
Implied volatility is a critical concept that frequently surfaces in the domain of trading, especially when discussing options. At its core, it measures the market’s forecast of a stock’s potential price fluctuations within a specific period. Unlike historical volatility, which looks at past market movements, implied volatility is forward-looking. It provides insights into how volatile investors expect the stock to be, which immediately influences the options pricing. When traders discuss implied volatility, they often reference the “fear gauge,” reflecting the market’s uncertainty about future events. This measure doesn’t predict the direction of price changes but rather the degree of price movement. As traders, understanding implied volatility gives you a strategic advantage. It allows for better timing of trades, enhancing the possibility of profitable ventures.
When implied volatility is high, the price of options generally increases due to expected larger swings in stock price, thereby raising potential for higher returns or losses. Conversely, low implied volatility often results in less costly premiums, presenting an opportunity to buy options at reduced costs. This relationship is pivotal in options trading, as investors analyze implied volatility when employing models like Black-Scholes to predict the pricing of an option. The reason Black-Scholes model is favored lies in its ability to calculate the theoretical option price, where implied volatility is a vital input. Enthusiasts in the market use it to gauge how much they should pay for an option and to estimate possible returns based on anticipated moves.
It’s worth noting, though, that while implied volatility is a robust tool, it doesn’t ensure that future market trends will follow suit. The keys to interpreting it effectively lie in understanding its implications on market dynamics and incorporating it into a comprehensive analysis rather than relying on it as a sole indicator. As an investor, staying informed about such elements and watching market trends can guide better decision-making. Leveraging implied volatility in line with other analysis techniques turns it into a valuable piece of the trading strategy puzzle.
How Implied Volatility Works
Understanding how implied volatility works is crucial for investors who wish to optimize their trading strategies. At its foundation, implied volatility gauges the expected swings in a stock’s price by reflecting market sentiment and potential future volatility. This level of volatility is not directly observable but is deduced from the prices of options. The rationale is that the more uncertain the market is about future price movements, the higher the implied volatility, which in turn elevates the option’s premium. Essentially, implied volatility acts as a barometer of market expectancy, reflecting broader economic indicators and investor sentiment.
In practice, traders often use implied volatility to identify entry and exit points. By knowing that high implied volatility results in higher premiums, a strategic investor might sell options when volatility is inflated to capitalize on higher premiums collected. On the flip side, buying options at low implied volatility can mean acquiring the option at a lower cost, with the potential for substantial gains if volatility spikes later. Calculating implied volatility involves intricate processes, often with the aid of sophisticated software that inputs factors such as current stock price, time to expiration, volatility models, and more to produce an accurate figure. Models like Black-Scholes are pivotal here, using inputs like the option’s market price to reveal the implied volatility, which becomes a critical determinant in further trades.
Furthermore, implied volatility doesn’t exist in a vacuum. It should be considered alongside historical volatility to provide a comprehensive view of potential price movements. Historical volatility gives context, allowing traders to see how current expectations compare to what has happened before. By comparing these, investors can discern whether the market’s current position on volatility is justified based on historical trends.
Investors should also be aware of factors capable of influencing implied volatility. Market events such as earnings reports, economic data releases, and geopolitical developments can cause spikes. Being attuned to these changes and their potential impact on volatility helps investors remain agile, adjusting their strategies to mitigate risks or capture gains. Ultimately, if deploys effectively, implied volatility can not only enhance decision-making but also serve as a key driver of return in the volatile landscape of options trading.
Implied Volatility and Its Role in Options Pricing
Implied volatility plays a pivotal role in the world of options pricing, affecting how investors assess risk and potential returns. By understanding its influence, traders can better navigate the options market, leveraging models like Black-Scholes to predict price changes. The concepts of implied volatility, option premium, and various affecting factors are all essential in shaping the strategies investors use. Let’s delve deeper into how implied volatility impacts the pricing of options and the myriad of factors influencing its fluctuations.
Implied Volatility and Option Premium
When you think about options trading, the term ‘option premium’ frequently comes to mind. This premium is essentially the price a trader pays to acquire an option contract, and implied volatility is a key determinant of that price. But how does it work? Well, the premium is heavily reliant on the expected fluctuations in the underlying stock price, which is where implied volatility comes into play. A higher implied volatility suggests greater expected swings in the stock, which, in turn, raises the premium. This is because potential price movements are perceived as risky by investors, justifying the higher cost of options. From a trading perspective, implied volatility provides a reflection of market sentiment, capturing investor anxiety and potential price moves without indicating the direction of movement.
Traders often use this measure to decide when to buy or sell options. High implied volatility might indicate that the market expects significant events or price perturbations ahead, causing the option premium to soar. For sellers, this presents a lucrative opportunity to command higher prices. Conversely, if implied volatility is low, the market might be anticipating calm, making now a strategic time for buyers to enter at lower premium costs. However, implied volatility doesn’t guarantee outcomes. It merely presents expectations, which means smart investors will use it alongside other tools, such as historical volatility, to piece together a fuller picture.
The option pricing model, particularly Black-Scholes, incorporates implied volatility as a vital input. This model helps traders ‘convert’ market prices into implied volatilities, aiding them in making decisions on the fair price of an option. Black-Scholes assumes a single or fixed implied volatility, although in reality, this rate can change due to varying market conditions or events. To navigate this, investors frequently rely on measures like ‘vega’, which tracks the sensitivity of the option’s price to changes in implied volatility. Understanding these intricacies gives traders a strategic edge, allowing them to exploit moments when the market’s expectations exceed or underestimate reality. Thus, masterfully managing implied volatility can translate into optimizing investments and maximizing gains.
Factors Affecting Implied Volatility
Implied volatility doesn’t operate in isolation; it’s influenced by numerous factors, each adding a layer of complexity to options pricing. Understanding these variables is crucial for any investor looking to optimize their strategy in the options market. A prominent factor includes market sentiment. News events, economic data releases, and geopolitical events significantly sway investors’ perceptions, causing fluctuations in implied volatility. For example, during earnings season, companies report profits or losses that can be surprisingly above or below market expectations, shaking investor confidence. Such occurrences often lead to spikes in implied volatility as traders adjust their outlooks on potential price movements.
Another vital component affecting implied volatility is the historical volatility of the underlying asset. By comparing current implied volatility with past movements, investors gain insight into whether the market’s current price expectations are reasonable. Though historical volatility reflects past performance, it provides context, allowing investors to see if the market is potentially underestimating or overestimating upcoming price swings. Hence, coupling data from both historical and implied volatility provides a broader understanding of how realistic market expectations are.
The option’s time to expiration is another factor. As expiration nears, implied volatility might either increase or decrease, depending on upcoming events and market stability. Investors often refer to ‘expiration rush,’ a period marked by increased volatility as uncertainty declines and traders rush to close or adjust their positions. This phenomenon is crucial as even a marginal fluctuation in implied volatility can mean significant gains or losses when dealing with options.
Moreover, macroeconomic factors such as interest rates and overall market volatility levels can sway implied volatility. When broader market volatility increases, options tend to become more expensive due to enhanced uncertainty. This also ties into the role ‘sigma’ or standard deviation plays, as it’s a measure of the volatility used in the Black-Scholes model. It reflects how much the market price of the option diverges from its expected path, informing traders of potential risks associated with various trades.
Accurate interpretations of these factors can help investors craft strategies that not only aim for high returns but also mitigate potential risks. Keeping a continual pulse on the options market and understanding these driving forces ensures that traders not only react to changes swiftly but also capitalize on them. It’s this blend of proactive and reactive strategies that truly levels up an investor’s prowess in the dynamic world of options trading.
Key Considerations for Investors Leveraging Implied Volatility in Options Strategies:
- Monitor real-time news for events that could swing market sentiment and impact implied volatility.
- Analyze the historical volatility of underlying assets to gauge market expectations.
- Evaluate option expiration impacts, particularly nearing the expiration rush.
- Stay informed on macroeconomic conditions like interest rates and their influence on market volatility.
- Use technical analysis tools to correlate sigma and market movements.
- Understand the implications of the Black-Scholes model on options pricing.
These insights help investors in proactively aligning their strategies with market dynamics.
Calculating Implied Volatility
Understanding implied volatility in the context of options trading is essential for investors aiming to enhance their decision-making. Calculating implied volatility involves unraveling several elements, each contributing to an investor’s ability to assess options pricing and market sentiment. Once investors grasp these calculations, leveraging options models like Black-Scholes becomes more intuitive, providing clear insights into pricing strategies. Exploring the key inputs necessary for an accurate calculation and the methods used to perform this task, such as iterative search, will enable investors to calculate this efficiently and apply the knowledge to trading strategies.
Key Inputs Required for Calculating Implied Volatility
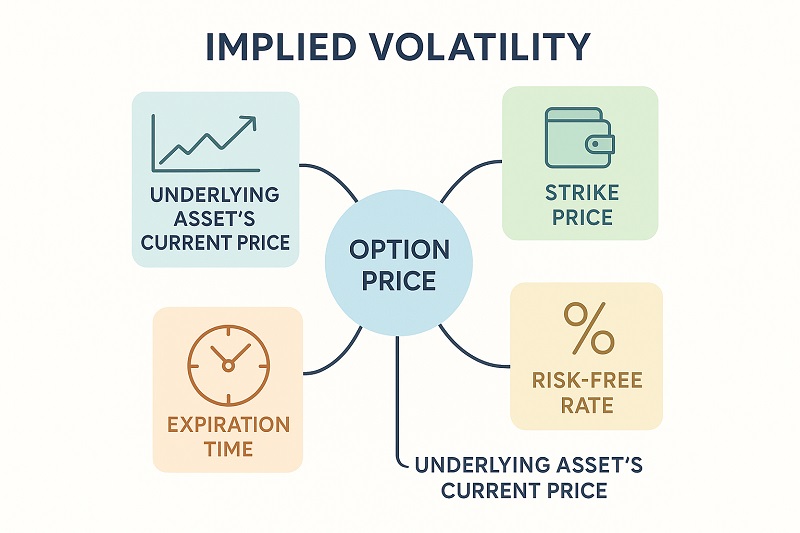
To calculate implied volatility accurately, investors must consider several key inputs that work together within options pricing models. The Black-Scholes formula is predominantly utilized, where these inputs play crucial roles. At the core of implied volatility is the market price of the option; this price reveals what traders are willing to pay given their expectations of future volatility.
Alongside this price is the option’s strike price, which sets the defined price a trader can buy or sell the option. These factors align with the current stock price, setting a benchmark against which volatility is measured. One often overlooked yet fundamental input is the time to expiration, reflecting how long the option has before expiry. Longer durations imply more potential for price swings, increasing implied volatility. Conversely, a shorter time frame reduces the perception of risk, impacting the calculation.
Interest rates also come into play, albeit indirectly, as they affect the discount rate used in options pricing. This component impacts the present value calculations in the Black-Scholes model, thereby influencing the volatility perceived by the market. A crucial aspect is the dividends expected during the option’s life, as they can alter payout expectations, affecting both implied and historical volatility.
Given these overlapping influences, it’s essential that investors continuously track these variables to keep their calculations relevant. Finally, the option’s intrinsic and extrinsic values, a blend of its current investment value and its speculative appeal, round out the list. Intrinsic value represents immediate profit, whereas extrinsic considers time value and implied volatility.
These input variables, part of a complex yet logical schema, anchor the model’s assumptions and calculations, helping investors to make informed trading decisions. As calculating implied volatility serves as the bedrock for strategic trades, maintaining a keen awareness of these factors is indispensable. Effectively utilizing these inputs allows traders to stay ahead of market shifts and adapt their strategies proactively, leveraging volatility changes for potential profit. Given the dynamic nature of the market, this understanding ensures investors are not simply reacting but strategically engaging in opportunities that may arise as they calculate implied volatility with precision.
How to Use Iterative Search to Calculate Implied Volatility
The iterative search method remains a preferred choice for calculating implied volatility, largely due to its precision in aligning market prices with the expected future price behaviors. Within the world of options pricing, where market conditions and variables are in constant flux, iterative search provides a sophisticated approach to unraveling the implied volatility hidden within the market price. The Newton-Raphson method is highly efficient, owing to its iterative capability of honing in on the implied volatility by continuously refining estimates. This technique helps resolve one of the major challenges in implied volatility calculations: the fact that it cannot be directly observed, only derived.
Starting with an initial guess, the iterative search employs a trial and error mechanism, adjusting inputs until the derived theoretical price of an option closely matches its actual market price. Each iteration uses the Black-Scholes formula to compare calculated option prices with observed real-world prices, adjusting volatility estimates accordingly. This feedback loop enables traders to converge on the most accurate implied volatility figure. Importantly, this method embraces real time data, allowing traders to make swift decisions amidst market shifts. Software tools capable of performing these calculations efficiently using languages like Rust or Python streamline this process, offering essential tools for traders.
Crucial to the success of an iterative process is understanding ‘vega,’ which measures the sensitivity of an option’s price to changes in implied volatility. Knowing an option’s vega informs how much a price can move in response to volatility fluctuation, thus guiding investors on its impact over the calculation. A delicate balance exists between precision and computational efficiency, with traders weighing the benefits of each as per their strategic alignment. When dealers seek to align their theoretical prices closely with the market prices, incorporating iterative methods confirms that calculated implied volatility is reliable and actionable. This process becomes a cornerstone in devising trading strategies that leverage options market volatility, underlining its importance in informed decision-making.
Ensuring proficiency in these calculations requires practice and a grasp of the mathematical nuances inherent to the Black-Scholes and similar models. However, once mastered, iterative search is indispensable, not just for its mathematical prowess but for its role in aligning theoretical models with real-world trading conditions. By engaging with this method, investors can consistently convert abstract market insights into concrete actions, bolstering their positioning within the options market. Consequently, mastery of these techniques enables investors to stay ahead, turning the calculation of implied volatility into a competitive edge within their trading strategies.
Comparing Volatility Measures
Understanding the differences between various volatility measures can significantly impact an investor’s strategy in trading. By comparing historical volatility with implied volatility, we gain insights into how past performance contrasts with future expectations. Additionally, examining the role of standard deviation helps predict expected price changes, which is crucial for making informed decisions under uncertain market conditions. Let’s delve into these comparisons to enhance our comprehension of volatility’s role in the dynamic world of trading.
Comparing Historical Volatility With Implied Volatility
When delving into the realms of trading, comparing historical volatility with implied volatility becomes essential for any informed investor. Historical volatility represents past price movements of a stock, providing a statistical measure of the rate at which the asset’s price has changed over a given period. On the other hand, implied volatility is forward-looking, estimating future price fluctuations based on current option market prices. This comparison isn’t just about numbers, it’s about understanding market psychology and risk assessment. Historical volatility uses past prices to evaluate how prices have varied in actuality, offering a concrete perspective of an asset’s past behavior. For instance, if a stock had wild price swings in the past, its historical volatility would be high. But past performance doesn’t guarantee future trends, and that’s where implied volatility steps in.
Implied volatility reflects collective market sentiment about future price changes. It doesn’t predict direction but rather anticipates the magnitude of future swings, serving as the ‘crystal ball’ that market participants use for gauging potential volatility. Unlike historical volatility, which is based on actual past prices, implied volatility is derived from option prices using models like Black-Scholes. It considers the premium investors are willing to pay, reflecting their expectations of future fluctuations. Therefore, while historical volatility offers a factual backdrop, implied volatility provides speculative foresight. Investors should note that implied volatility can be heavily influenced by market expectations, news releases, or even geopolitical changes, meaning it can fluctuate quickly.
Traders strategically use these differences to refine their strategies. For example, if current implied volatility is significantly higher than historical volatility, it might indicate elevated market anxiety or anticipated future events that could lead to substantial price movements. This could be a cue for investors to adjust their positions, either by hedging against risks or capitalizing on potential price changes. Conversely, if implied volatility is lower, it might suggest market complacency or a lack of expected turmoil, which could position an investor for a less volatile scenario. Ultimately, understanding and comparing these measures allow investors to gauge whether they should align their strategies with market expectations or challenge them, thus enhancing decision-making in stock and options trading. Keeping a vigilant eye on the historical versus implied volatility distinctions allows investors to better maneuver through the complexities of market dynamics.
Standard Deviation and Expected Price Changes
When considering expected price changes, standard deviation plays a pivotal role in the calculation of an asset’s volatility. In essence, standard deviation measures the extent of variation or dispersion in a set of financial data points, giving investors a solid grasp of risk and uncertainty within market prices. It’s integral for investors aiming to predict price changes in assets, as standard deviation provides the statistical framework guiding price fluctuation analysis. By incorporating this measure, traders effectively assess the volatility depicted by a stock’s past performance. However, it takes on greater relevance when aligned with models like Black-Scholes, which utilizes it within options pricing.
The standard deviation is used in Black-Scholes to estimate the volatility of a stock in terms of its returns. Higher standard deviation translates into higher perceived risk as it indicates larger swings in stock prices, while lower standard deviation signifies less volatile and potentially risk-averse movements. This yardstick of volatility helps investors make predictions on how a stock could behave under different market scenarios, formulating strategies that either capitalize on volatility or mitigate against it. When applied to options trading, understanding standard deviation can determine the premium an investor is willing to pay or receive based on anticipated swings in the underlying asset’s price.
Investors who employ trading strategies that involve the calculation of implied volatility must be keenly aware of standard deviation because it inherently influences expected price changes. It not only helps in gauging historical trends but also in aligning implied volatility expectations with realistic market movements. This dual advantage serves as a comprehensive predictor of potential price changes, a critical factor for strategic planning in options trading. Meticulously analyzing standard deviation aids investors in mapping risk, noting how much prices deviate from average expectations. This is pivotal for predicting future price changes and establishing an informed stance in options market movements.
Moreover, traders often align these insights with practical tools and models to predict price changes more efficiently. As market conditions fluctuate, the ability to nimbly adapt strategies based on standard deviation and expected price changes affords investors a competitive edge. By routinely calculating and interpreting standard deviation alongside implied and historical volatility, investors equip themselves with a thorough analytical toolkit. This prepares them for prudent, timely decision-making in trading futures, stocks, and options, ultimately shaping their investment strategies to maximize returns while judiciously managing risk.
The Impact of Changing Implied Volatility on Options
Changing implied volatility can significantly affect options pricing, influencing an investor’s strategic choices in the options market. It is critical to understand how these changes affect option prices, as implied volatility is closely tied to the perception of risk and the expected magnitude of price swings. As an investor, grasping this can enable more informed decisions when leveraging options strategies and employing models like Black-Scholes to determine theoretical values. Let’s delve into the specifics of how variations in implied volatility directly impact option prices and investor strategy.
How Do Changes in Implied Volatility Affect Options Prices?
Changes in implied volatility are crucial to understanding how option prices fluctuate. When implied volatility increases, the expected future volatility of the underlying stock rises, meaning larger potential price swings. This anticipatory measure doesn’t predict specific directional movements but suggests a greater magnitude of fluctuations. In practical terms, if implied volatility increases significantly, option prices, especially the option premium, tend to increase. This rise occurs because higher volatility forecasts greater risk and potential profit, making options more valuable due to the wider range of possible outcomes. The Black-Scholes model heavily references this dynamic; implied volatility is a critical input when calculating the theoretical market price of options, dictating premiums investors are willing to pay.
Conversely, when implied volatility decreases, this implies the market expects less price movement. Accordingly, option prices decrease since there’s less perceived risk. For options traders, these fluctuations in implied volatility can act as a signal. High implied volatility might encourage strategies like selling options to capture higher premiums, betting on the volatility returning to lower historical levels. On the other hand, investors might purchase options during periods of low implied volatility, anticipating future increases that could result in profitable swings. This behavior reflects the ‘volatility smile,’ observed where traders expect options prices to rise with high volatility and fall with low.
Furthermore, changes in implied volatility can affect the ‘vega’ of an option, another critical element in the options market. Vega measures the sensitivity of an option’s price to a 1% change in implied volatility. If an option has a high vega, a rise in implied volatility will significantly affect its premium. Thus, understanding vega’s impact allows investors to strategize adequately, particularly during volatile market conditions. Strategic traders often employ models that leverage vega and other metrics to finely tune their responses to market changes. Incorporating implied volatility shifts within broader investment strategies can offer a competitive edge, helping traders optimize returns while managing risks in an unpredictable market environment.
Ultimately, mastering the interplay between implied volatility and options pricing equips investors to act decisively. By utilizing calculations, such as those provided by Black-Scholes, and keeping a continuous watch on market dynamics, investors can turn potential volatility changes into opportunities. It’s not just about reacting to changes in implied volatility but using them proactively to forge strategies that capitalize on market inefficiencies. By balancing potential risks and rewards, investors can pave the way to enhance their trading activities effectively.
Understanding and calculating implied volatility can empower investors to make informed decisions. By accurately assessing market sentiment and potential price fluctuations, you gain a strategic advantage in your trading activities. Dive deeper into options trading and leverage available tools to streamline your calculations, ensuring that you’re always a step ahead. Whether you’re considering a bold move or simply want to refine your portfolio, mastering implied volatility is an essential skill in today’s dynamic market landscape.
FAQ: Implied Volatility Explained
What is implied volatility in options trading?
Implied volatility is a metric that reflects the market’s expectation of future volatility in an asset’s price. It’s crucial for determining an option’s price and is an indicator of the potential price swings expected by traders.
Why is it important to compare historical volatility with implied volatility?
Comparing historical volatility with implied volatility helps traders understand how the market’s future expectations align with past price movements. This analysis can reveal whether market expectations are justified based on historical trends, aiding in making informed investment decisions.
What factors influence changes in implied volatility?
Several factors influence implied volatility, including market sentiment, economic events, interest rates, and the time to expiration. News releases, earnings reports, and geopolitical developments can cause significant shifts in market expectations and volatility levels.
How can understanding implied volatility improve your trading strategy?
By mastering implied volatility, traders can better predict option price changes, identify strategic entry and exit points, and optimize their trading strategies. This understanding allows for more effective hedging, risk management, and the potential to capitalize on market inefficiencies.