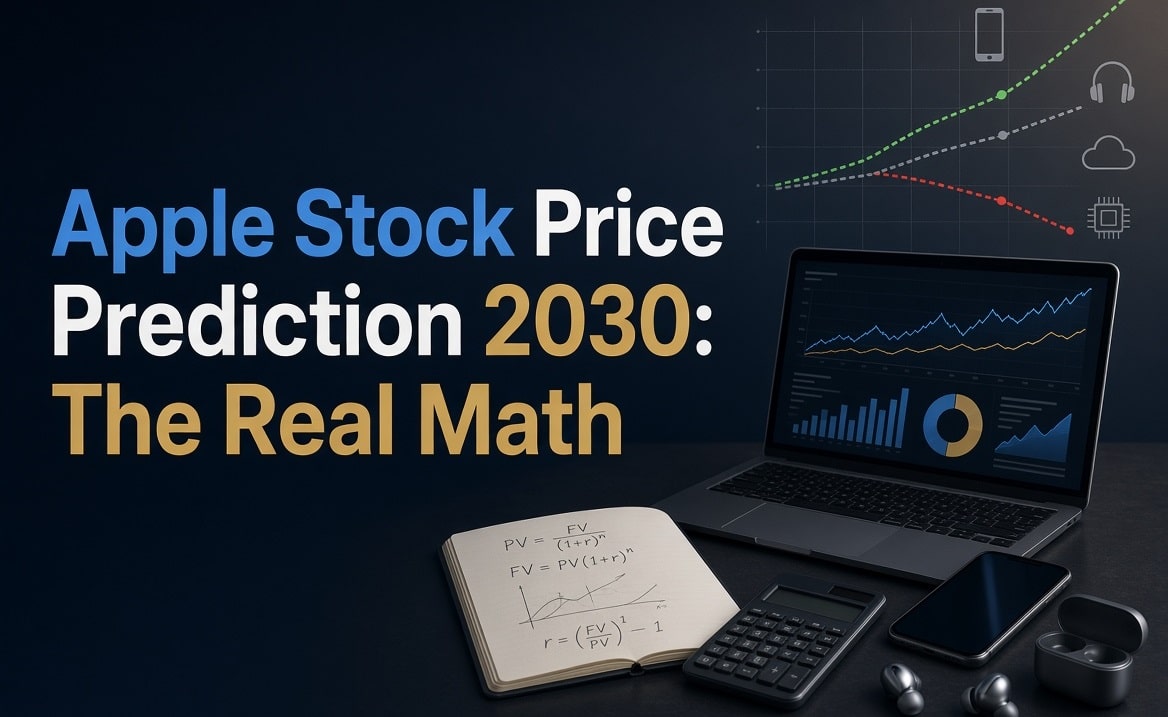
Apple closed at a record $349.51 on November 4, then slipped to $344.17 on November 5. So any Apple stock price prediction for 2030 has to start with a blunt question: what must Apple earn to justify today’s price, let alone $500 or $1,000?
Most forecast pages skip that question. They publish a number, usually pulled from a trend line, and they never show the earnings math behind it. This guide does the opposite. It combines Apple’s fiscal 2026 results, the new gross margin warning, current analyst targets and simple EPS-times-multiple scenarios to show which 2030 outcomes look realistic. Every fact comes from reports published between October 20 and November 6, 2026, and my own calculations carry a label.
The short answer: My base case for AAPL in 2030 is about $394, inside a range of roughly $283 to $550. Published forecasts run from $287 to $966 because each one rests on different assumptions. Here are mine, laid out in the open.
Apple Stock Price Prediction 2030 at a Glance
| Scenario | EPS growth per year | FY2030 EPS | P/E multiple | 2030 price | vs. $344.17 |
| Downside | 6% | $11.34 | 25x | $283 | −18% |
| Bear | 8% | $12.22 | 25x | $305 | −11% |
| Base | 10% | $13.15 | 30x | $394 | +15% |
| Bull | 15% | $15.71 | 35x | $550 | +60% |
My math, starting from fiscal 2026 EPS of $8.98. The 6% row matches the growth analysts expect for fiscal 2027. These are scenarios, not promises.
Apple Stock Today: Record High, Ternus’s First Earnings and the Memory Squeeze
Apple reported fiscal fourth-quarter 2026 results (July to September) on November 2. It was the first report under CEO John Ternus, who took over from Tim Cook on September 1. The headline numbers beat estimates. The margin outlook did not.
Q4 FY2026 Results vs. Estimates
| Metric | Q4 FY2026 result | Analyst estimate |
| Revenue | $114.5 billion (up 12%) | $113.4 billion |
| Diluted EPS | $2.10 (up 14%) | $1.99 |
| iPhone revenue | $57.6 billion (up 17%) | $56.5 billion |
| Mac revenue | $10.8 billion | $9.6 billion |
| iPad revenue | $6.2 billion | About $6.7 billion |
| Services revenue | $31.6 billion (up 10%, record) | About $31.5 billion |
| Gross margin | 47.9% | 47.5% |
For the full fiscal year, Apple posted record revenue of $478.8 billion (up 15%), net income of $132.2 billion and EPS of $8.98 (up 20%). Greater China grew 21%, a quarterly record. However, one-time tariff refunds added $0.05 to EPS and about one point to gross margin, so the quarter looks slightly better than the underlying business.
The 45–46% Margin Warning
The trouble started with the December-quarter guide. Apple expects revenue to grow 7% to 10%, which beats the roughly 6.1% analysts wanted. Gross margin, though, should land between 45% and 46%. That misses the 46.3% estimate and marks Apple’s lowest midpoint since fiscal Q4 2023. Services growth also slows to 8% to 9%, against about 10.7% expected, and it extends a third straight quarter of deceleration.
Memory Costs and the Siri AI Ramp
CFO Kevan Parekh blamed two things: higher memory costs and the expense of ramping Siri AI. Ternus called current memory pricing unprecedented, and he said Apple expects prices to keep rising after December. Memory shortages will also limit Mac and iPad supply this quarter.
Apple already responded with higher prices. The iPhone 18 Pro now starts at $1,199, a $100 increase, and Apple raised Mac, iPad and home-device prices by 15% to 33% earlier this year. Tim Cook described the memory squeeze in July as a 100-year-flood event.
Why One Margin Point Matters
Each point of gross margin equals about $0.09 per share in the December quarter, according to TheStreet’s read of Oppenheimer’s math. So a one-to-two point miss against the old 47% estimate costs roughly $0.09 to $0.18 of EPS. That sounds small. However, it matters at a stock trading near 36 times forward earnings.
Why AAPL Jumped 5% Two Days Later
The stock fell as much as 4% on November 3 before closing 1.9% lower at $331.90. Then it reversed. On November 4, AAPL rose 5.31% to a record close of $349.51.
The move followed the midterm elections, where Democrats won control of both chambers of Congress. Investors rotated out of AI hardware stocks on fears of new data center limits, and Apple’s light AI spending made it a haven. Evercore ISI’s Amit Daryanani also pointed to possible relief on memory prices if data center construction slows. On November 5, chip stocks dropped sharply and Apple slipped 1.5% to $344.17.
Is Apple a Strong Buy Right Now?
Wall Street leans toward Buy, but it doesn’t lean hard. Before earnings, 22 of the 39 analysts Barchart tracks rated Apple a Buy, 14 said Hold and three said Sell. After the report, the average target across 43 analysts landed at $333.28, about 3% below Thursday’s close. In short, the crowd likes the company more than it likes the price.
Apple Analyst Price Targets After Q4
| Firm | Rating | Price target |
| Argus | Buy | $400 (from $375) |
| TD Cowen | Buy | $390 (from $400) |
| Goldman Sachs | Buy | $380 (from $390) |
| Bernstein | Outperform | $380 (from $370) |
| Evercore ISI | Outperform | $380 |
| JPMorgan | Buy | $355 |
| Morgan Stanley | Overweight | $350 (from $355) |
| UBS | Neutral | $340 (from $296) |
| Loop Capital | Hold | $330 (from $370) |
| Freedom Broker | Hold | $310 (from $240) |
| DZ Bank | Sell | $300 (downgrade) |
| Barclays | Underweight | $261 (from $245) |
The spread is wide. Argus sits about 16% above the current price, while Barclays sits about 24% below it. Morningstar goes further and puts fair value at $290. The highest published 12-month target I found is $405.
Is It Too Late to Buy Apple Stocks?
It depends on your horizon, and the valuation math explains why. At $344.17, Apple trades at about 36 times the $9.55 consensus EPS for fiscal 2027. That consensus is only 6% above fiscal 2026’s $8.98. So buyers pay a premium multiple for single-digit near-term growth.
Not everyone sees an upside from here. Oppenheimer cut its fiscal 2027 EPS to $8.91, about 7% below consensus, and it warned that the multiple sits near the top of Apple’s 15-year range. Morningstar trimmed its estimate to $9.32. On the other side, TD Cowen still sees $9.75 of EPS for calendar 2027, citing better 2-nanometer chip supply and roughly 12% iPhone revenue growth.
What Would Change the Picture
Two things could. First, memory prices could ease, which would let gross margin recover toward 47%. Second, the iPhone Duo and Siri AI could lift Services and upgrade rates faster than analysts expect. Until one of those happens, the stock has little room for a margin miss.
How High Will Apple Go in 2026?
Apple has about eight weeks left in 2026, and it already hit a record. The stock traded above $354 on November 4, and its 52-week low sits at $243.42. For the rest of the year, the realistic ceiling comes from the top analyst targets, which run from $380 to $405.
AltIndex’s AI model offers one more data point. On October 5, when AAPL traded at $332.89, it set a six-month target of $377.22. The next hard test arrives with December-quarter earnings, tentatively set for February 4, 2027. Consensus calls for EPS near $2.90 and revenue near $152 billion.
Apple Stock Price Prediction 2027
For fiscal 2027, consensus EPS sits at $9.55 on revenue of $522 billion. Analysts disagree on the details. Morgan Stanley expected about $10 before the report, TD Cowen sees $9.75 for calendar 2027, Morningstar sees $9.32 and Oppenheimer sees $8.91.
Morningstar also argues that 2027 iPhone growth will come almost entirely from higher prices, with flat unit sales. Meanwhile, it expects margins to compress by about two points as memory costs bite.
| FY2027 EPS | At 30x | At 33x | At 36x |
| $8.91 (Oppenheimer) | $267 | $294 | $321 |
| $9.55 (consensus) | $287 | $315 | $344 |
| $10.00 (Morgan Stanley) | $300 | $330 | $360 |
My math. Multiples shown are examples, not forecasts.
The table shows the problem. Today’s price already assumes about 36 times consensus EPS. To climb meaningfully in 2027, Apple needs either higher earnings or a higher multiple, and the margin guide argues against both.
Apple Stock Price Prediction 2030
Now the main event. First, here is what published forecasts say. Then I’ll show the math that sorts the realistic ones from the rest.
What Published Forecasts Say
| Source | 2030 forecast | What to know |
| Benzinga and Yahoo (SoFi) | $287 to $410 | Written when AAPL traded near $224 |
| Motley Fool | $350 to $520 | Early 2026 article |
| LiteFinance roundup | $348 to $632 | Collects several calculators |
| StockScan | $580 average, $612 high | Monthly table from a statistical model |
| AltIndex | $621 | Linear extrapolation, updated October 5 |
| cfgi.io | $503 average | Average of three AI chatbot forecasts |
| Telegaon | $684 average | Statistical model |
| TradersUnion | $966 | Statistical model |
The spread runs 3.4 times from low to high. Two problems explain it. First, older pages anchor on a stock price that no longer exists. Benzinga’s $287 low sits 17% below today’s price. Second, the high-end pages extrapolate price history and never ask what earnings that price would require.
The EPS × P/E Math Behind Every 2030 Target
A stock price equals earnings per share times the multiple investors pay. So a 2030 target is really two bets. This grid starts from fiscal 2026 EPS of $8.98 and compounds it for four years.
| EPS growth per year | FY2030 EPS | At 25x | At 30x | At 35x |
| 6% | $11.34 | $283 | $340 | $397 |
| 8% | $12.22 | $305 | $367 | $428 |
| 10% | $13.15 | $329 | $394 | $460 |
| 12% | $14.13 | $353 | $424 | $495 |
| 15% | $15.71 | $393 | $471 | $550 |
My math, in dollars per share.
Three takeaways stand out:
- $500 needs 16.7% EPS growth per year at 30x. That means $16.67 of EPS, or nearly double fiscal 2026.
- My base case returns only about 3.5% a year in price. Going from $344 to $394 over four years leaves little reward, plus a dividend yield near 0.3%. Bears land at about −3% a year, and bulls at about 12%.
- Consensus already looks hard to beat. Fiscal 2027 EPS growth of 6% means the base case needs growth to speed up, not just continue.
What gets the bull case moving? Apple has a $100 billion buyback authorization from April, which shrinks the share count and lifts EPS. It also has Services, which generated $123.3 billion in fiscal 2026, and a new foldable. Morningstar expects Services to grow more than 10% annually over the next five years.
For $500 specifically, the stock needs roughly 9.8% a year in price gains for four years. For $750 it needs about 21.5%, and for $1,000 about 30.6%.
Apple Stock Price Prediction 2030 by Month: The Catalyst Calendar
Some sites publish month-by-month price tables for 2030. I won’t, because nobody can forecast a single month four years out, and the tables mostly show a smoothed trend line. A catalyst calendar is more useful.
| When | Event | Why it matters |
| November 16, 2026 | Berkshire Hathaway’s Q3 13F filing | Shows whether Greg Abel still holds about 228 million Apple shares |
| November 17, 2026 | Nvidia earnings | Sets the tone for mega-cap tech and AI spending |
| February 4, 2027 (tentative) | Apple December-quarter earnings | First full quarter with iPhone Duo; margin guide gets tested |
| Spring 2027 | Expected base iPhone 18, iPhone Air 2 and iPhone 18e | Tests demand beyond the Pro models |
| June each year | Developer conference | Updates the Siri AI roadmap |
| September each year | iPhone launch and fiscal year-end | Resets the holiday outlook |
| Late Jan, Apr, Jul and Oct | Quarterly earnings | Margin, Services and China updates |
Apple Stock Prediction 2030 on WalletInvestor and Other Calculators
People search for WalletInvestor and similar calculators because they give a clean monthly line. In LiteFinance’s roundup, WalletInvestor leans bullish through most of 2030, while CoinCodex sees a first-half rise followed by a correction. Still, these tools extrapolate price history. They ignore memory costs, the Services mix and Apple’s valuation. Use them as a cross-check, never as the main case.
What Will Apple Be in 5 Years?
In five years, Apple should look like a bigger Services company with a foldable lineup. Services already bring in about 26% of revenue ($123.3 billion of $478.8 billion in fiscal 2026), and iPhone still contributes about half of quarterly sales. Price paths for late 2031 depend on the annual gain:
| Annual price gain | Apple stock price in 2031 | Implied market value |
| 6% | $461 | $6.7 trillion |
| 8% | $506 | $7.4 trillion |
| 10% | $554 | $8.0 trillion |
| 12% | $607 | $8.8 trillion |
My math from $344.17 and about 14.53 billion shares.
Apple Stock Prediction for the Next 10 Years: 2035 and 2040
Ten-year forecasts carry huge error bars. Still, compounding math shows what each path would deliver.
Apple Stock Price Prediction 2035
| Annual price gain | Price in 2035 |
| 6% | $581 |
| 8% | $688 |
| 10% | $812 |
| 12% | $954 |
What Will Apple Stock Be Worth in 2040?
| Annual price gain | Price in 2040 |
| 6% | $778 |
| 8% | $1,011 |
| 10% | $1,307 |
| 12% | $1,682 |
My math from $344.17. These show what a growth rate would produce, not a prediction.
One statistical site projects an average near $2,439 by the end of 2036. That would require a company worth about $35 trillion. I treat that number as noise.
Will Apple Stock Ever Reach $1,000?
Yes, it can, but the arithmetic is demanding.
The $14.5 Trillion Math
Apple has about 14.53 billion shares outstanding. At $1,000 per share, its market value would reach about $14.5 trillion, nearly three times today’s $5 trillion. For context, Apple briefly passed Nvidia in late October, with about $5.03 trillion against Nvidia’s $4.93 trillion. Buybacks shrink the share count over time, so the real hurdle drops a little each year.
How Long Would It Take?
| Annual price gain | Year Apple crosses $1,000 |
| 6% | About 2045 |
| 8% | About 2040 |
| 10% | About 2038 |
| 12% | About 2036 |
| 15% | About 2034 |
My math from $344.17.
So $1,000 before 2030 would take an annual gain above 30%. Over the next ten to fifteen years, however, it needs only a respectable 8% to 10% a year.
Apple Stock Prediction Tomorrow and This Week
Nobody can call tomorrow’s move. Apple moved −1.9% on November 3, +5.3% on November 4 and −1.5% on November 5, and each day had a different driver. Instead of a guess, watch these levels and events:
- Levels: $331.90 (November 3 close), $344.17 (November 5 close), $349.51 (record close) and the $354 area (record intraday).
- Events this month: Berkshire’s 13F on November 16 and Nvidia’s earnings on November 17.
- Wildcards: Chip-sector policy headlines and any news on memory prices.
What Did Warren Buffett Say About Apple Stock?
Buffett has long admired Apple’s loyal customer base, and he has said he would buy more at the right price. His actions tell the fuller story.
Berkshire’s Apple Stake Today
Berkshire first bought Apple in early 2016. Over about two years, it sold nearly 688 million shares, then Buffett retired as CEO on December 31, 2025. Greg Abel took over, and Berkshire has not sold any Apple since. As of June 30, 2026, it held 227.9 million shares worth about $66 billion, roughly 1.56% of Apple and 22% of Berkshire’s stock portfolio.
What 5 Stocks Is Warren Buffett Buying?
Under Abel, Alphabet became the headline purchase. Reports say Berkshire tripled its stake in its first filing under Abel, then bought about $17 billion of Alphabet stock in the second quarter, including $10 billion directly from the company. It also opened a $2.65 billion Delta Air Lines position. At the same time, it exited Amazon, Visa, Mastercard, Domino’s and UnitedHealth. The November 16 filing will show the latest moves.
What Is Buffett’s Favorite Stock?
Buffett never names one. Still, Apple is Berkshire’s largest holding at 22% of the portfolio. American Express (about 17%) and Coca-Cola (about 11%) follow, and both held steady in recent quarters.
Vanguard holds the biggest stake. Institutions own about 63.5% of Apple, and insiders hold only about 0.06%.
| Holder | Shares | Stake |
| Vanguard Group | 1.43 billion | 9.7% |
| BlackRock | 1.15 billion | 7.8% |
| State Street | 604 million | 4.1% |
| Geode Capital Management | 358 million | 2.4% |
| Berkshire Hathaway | 228 million | 1.6% |
Holdings come from regulatory filings with slightly different dates.
What Will the Nvidia Stock Price Be in 2030?
No single number holds up. Published Nvidia forecasts for 2030 range from about $228 to more than $4,000, which shows how little the trend-line models agree on. Use the same EPS × P/E method instead. Nvidia reports on November 17, and its guidance will reset analyst estimates for the whole AI sector, Apple included.
Key Risks Before You Invest in Apple
- Memory costs: Management expects prices to rise past December, and margins may fall further.
- Services slowdown: Growth guidance of 8% to 9% marks a third straight quarter of deceleration.
- Valuation: About 36 times fiscal 2027 consensus EPS leaves little room for misses.
- iPhone concentration: The iPhone brought in about half of Q4 revenue.
- One-time boosts: Tariff refunds helped fiscal Q4, and they won’t repeat.
- AI execution: Siri AI now runs on Google’s Gemini model, and it adds cost before it adds revenue.
How I Built This Apple Stock Price Prediction
I pulled Apple’s results, analyst notes and published forecasts from October 20 through November 6, 2026. Then I cross-checked each number against at least one other source. For example, one outlet listed iPhone revenue at $54.3 billion, but Apple’s reported figure is $57.6 billion, so I used the latter. I calculated every scenario, market value and growth rate myself from fiscal 2026 EPS of $8.98, a share count near 14.53 billion and the November 5 close of $344.17, and I label each one as my math. I will refresh this post after each earnings report.
Conclusion
Apple earns record profits, yet the stock already prices in a lot of good news. My Apple stock price prediction for 2030 centers on about $394, with $283 as a downside and $550 as a bull case. Reaching $500 requires roughly 17% annual EPS growth at a 30x multiple, and $1,000 before 2030 would need a miracle. Over a longer window, though, steady 8% to 10% annual gains can carry AAPL past $1,000 by the late 2030s. Therefore, size your position for the swings Apple delivered this week, and watch margins, because they decide most of what happens next.
FAQs
Will Apple stock ever reach $1,000?
It can, but not soon. Apple would need a market value near $14.5 trillion, almost triple today’s level. At 8% annual gains, the stock crosses $1,000 around 2040, and at 10% it crosses around 2038. Before 2030, it would need annual gains above 30%.
What will Apple stock be worth in 2030?
My base case is about $394, with a range of $283 to $550. That comes from 6% to 15% annual EPS growth and multiples between 25x and 35x. Published forecasts range from $287 to $966, so treat any single number as one scenario.
Is Apple a strong buy right now?
Wall Street leans toward Buy, but the average target ($333.28) sits below the current price. Before earnings, 22 of 39 tracked analysts rated it a Buy. Apple’s record profits support the case, while its 36x forward multiple and margin warning argue for caution.
Is it too late to buy Apple stocks?
That depends on your horizon. At 36 times consensus fiscal 2027 EPS, short-term upside looks limited, and my base case returns only about 3.5% a year in price. Long-term holders have more room, because buybacks and Services growth can lift EPS over time.
What did Warren Buffett say about Apple stock?
Buffett praised Apple’s loyal customer base and said he would buy more at the right price. Berkshire still holds 227.9 million shares, about 22% of its stock portfolio. It sold roughly 688 million shares over two years, but it has not sold any since Greg Abel became CEO.