There’s a certain kind of investor who walks into every market conversation armed with unshakable certainty. You’ve met them. They appear in forums, on social feeds, and at trading desks during every bull run and every bear market slide. They carry a single favorite indicator like a sacred relic and declare exactly where the market is headed, why it must go there, and precisely how you should position yourself to profit. They debate RSI versus MACD with the fervor of theologians. They quote crossovers and divergences as gospel. Yet they almost never pause to test whether their convictions actually hold up in real market conditions.
The uncomfortable truth is that the market does not reward opinions. It rewards process. Somewhere, far removed from the daily noise of hot takes and headline-driven trading, a researcher named Fuwang He took the road less traveled. In the study “The Best Combination of Indicators for the U.S. Stock Market,” He examined more than 1,400 distinct indicator strategies stretched across decades of U.S. equity data. There were no cherry-picked charts, no compelling narratives, and no hindsight storytelling. Just raw numbers, clean methodology, and results that cut through the clutter.
What emerged from that work is refreshingly straightforward. It is not wrapped in mystery or complexity. The four best trading indicators—and the way they work together—turn out to be the very tools that reward patience, confirmation, and disciplined filtering rather than early guesses or emotional reactions. Today, that foundational research finds a powerful modern partner in brand-new AI technology.
TradeSmith’s Signals platform, built on Behavioral Profile Analysis (BPA), takes the core lessons from He’s study and scales them across thousands of stocks with millions of daily evaluations.
This article walks you through each of the four indicators in depth, explains why certain behaviors succeed while others fail, reveals the precise combinations that delivered the strongest performance, and shows how TradeSmith’s AI Signals research—set to debut at the live AI Signals Trading Event on April 22—puts these ideas into automated, real-time practice. By the end, you will have a complete, testable framework plus a look at the cutting-edge tool that could change how you apply it.
The Endless Search for the “Best” Indicator
Every trader begins the journey in the same way. You open a charting platform, plot price, and begin layering on tools. One indicator, then another, then a third. You are hunting for clarity, for the elusive signal that removes hesitation and tells you exactly what to do next. At first the lines feel helpful. Soon they begin to contradict one another. The chart grows cluttered. What once promised certainty now delivers confusion.
Most traders respond to that confusion in one of two ways: they either abandon technical analysis altogether or they start guessing, cherry-picking the signals that feel right in the moment. The study took the opposite path. It stripped the process down to fundamentals. Each indicator was tested in isolation across thousands of historical trades. Only after individual performance was measured did the research move to combinations. The goal was never to find a magic bullet that wins every time. It was to identify which tools, used in which specific ways, actually improved outcomes when measured by risk-adjusted returns over long periods.
Right from the first round of tests, one family of tools rose to the top on the long side. The key was not in the indicators themselves but in how traders interacted with the signals they produced. Fast-forward to 2026, and TradeSmith’s new research shows how artificial intelligence can automate and refine exactly that interaction—creating individualized behavioral profiles for over 2,467 stocks and evaluating up to 10.4 million potential trade combinations every morning.
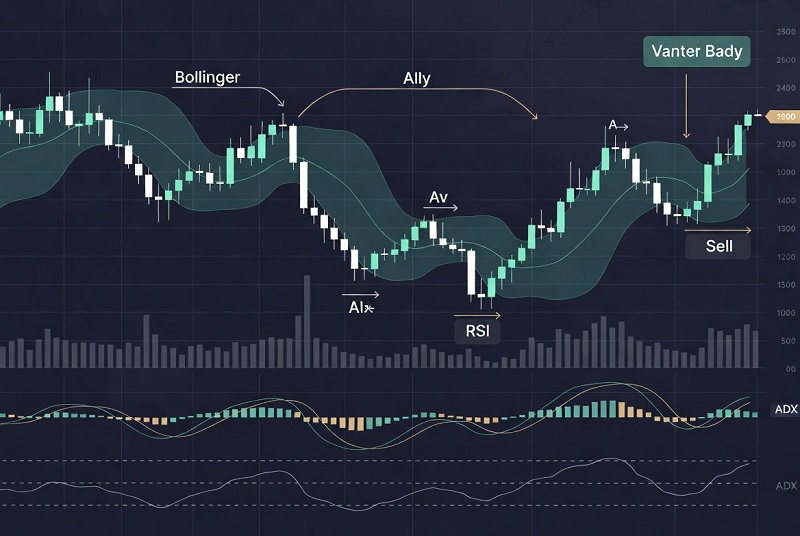
Bollinger Bands: Where the Market Breathes
Bollinger Bands are among the most visually recognizable tools on any chart. Two outer lines wrap around price action like a flexible envelope, expanding during periods of high volatility and contracting when the market quiets. The middle line is typically a simple moving average, while the outer bands are plotted at a set number of standard deviations away from that average.
To the casual observer, the bands look like hard boundaries. Price touches the lower band and it must be time to buy because the asset is “cheap.” Price kisses the upper band and it must be time to sell because the asset is “expensive.” This interpretation feels intuitive. It also fails more often than it succeeds. Markets do not reverse simply because price has reached an extreme statistical boundary. What the bands actually reveal is something subtler and far more useful: when price has moved unusually far from its recent average behavior. In other words, when the market has stretched.
Stretched markets do not snap back on command. Euphoria can persist. Panic can deepen. The traders who struggled in the study were those who treated the bands as reversal signals and stepped in the moment price touched an extreme. They tried to catch the falling knife or sell into the final parabolic surge. Their timing was consistently off.
The traders who succeeded followed a different protocol. They watched price move outside the bands and did nothing. They allowed the panic or euphoria to fully express itself. Only when price began to migrate back inside the bands—signaling that the extreme move had lost momentum—did they consider entering. That return inside the bands became the actual trigger. It was confirmation that the stretch had ended and stability was returning.
Think of an elastic band being pulled taut. You do not release your arrow while the band is still being drawn back; you wait until it starts to spring forward. That single shift in timing transformed Bollinger Bands from a mediocre reversal tool into the strongest long-side performer in the entire dataset. The edge came from waiting for the market to breathe out after it had inhaled too deeply.
This approach carries important implications for position sizing and risk management. Because you are entering after the initial volatility spike has begun to subside, stop-loss placement can often be tighter relative to the recent range. The trade is no longer fighting the prevailing emotional extreme; it is riding the first signs of normalization. Over hundreds of historical instances, this waiting period produced entries with better average reward-to-risk ratios than impulsive band-touch trades.
Yet the power of Bollinger Bands is not automatic. It requires traders to override their natural instinct to act at extremes. That override is where most retail participants falter. They see price at the lower band and feel the emotional pull of “value.” The disciplined process demands the opposite: patience while the stretch plays out, followed by action only on the return to normalcy. When followed consistently, this behavior alone separated winning long strategies from the crowd.
TradeSmith’s new Behavioral Profile Analysis takes this exact concept and makes it stock-specific. In one documented example, Invesco (IVZ) triggered a signal when Bollinger Percent B and Money Flow Index both exceeded 80—conditions that historically led to an 18.8 percent gain in just 11 days. The AI doesn’t apply generic bands; it builds a unique profile for IVZ and flags when those conditions align with that stock’s past behavior.
Keltner Channels: The Quiet Discipline of Smoother Boundaries
Keltner Channels operate on a similar philosophy but with a calmer temperament. Like Bollinger Bands, they consist of a central line flanked by upper and lower boundaries. The difference lies in construction. Where Bollinger Bands use standard deviation to measure statistical volatility, Keltner Channels typically rely on average true range (ATR). The result is a set of boundaries that move more smoothly and react less dramatically to sudden price spikes.
If Bollinger Bands expand and contract like lungs responding to every breath of volatility, Keltner Channels glide through the same environment with steadier intent. They are not asking how far price has deviated in a pure statistical sense. They are asking a simpler question: has price moved outside its typical daily or weekly range?
The successful behavior mirrored the Bollinger Bands approach. Price would exit the channel during a strong move. Traders would feel the familiar urge to jump in immediately. The disciplined response was to wait. Only when price returned inside the channel did the signal activate. The trade was taken not at the point of maximum stretch but at the first sign that the stretch had exhausted itself.
The temperament difference is significant. Keltner Channels sacrifice some of the dramatic expansion seen in Bollinger Bands. They filter out a portion of the noise and give up a small amount of early-move participation. In return, they deliver higher consistency. For traders who value sleep-at-night reliability over adrenaline, this trade-off proved worthwhile. The study showed that Keltner-based strategies produced fewer false signals and more stable equity curves than their more volatile Bollinger counterparts, even if the absolute best single trades were slightly smaller.
In practical terms, Keltner Channels shine in markets where volatility is elevated but not chaotic. They help traders avoid the whip-saw entries that occur when price briefly kisses an extreme and then reverses violently. By demanding the return inside the channel, the strategy forces confirmation that the move has lost steam. That confirmation is what turns a good idea into a repeatable process.
When layered into AI systems like TradeSmith Signals, Keltner-style logic becomes part of a broader behavioral profile that also incorporates sector dynamics and calendar effects—creating signals that feel both familiar and dramatically more precise.
The Moment Everything Changes: Why Shorting Demands a Different Mindset
Up to this point the framework feels almost intuitive. Identify a stretched condition, wait for normalization, and enter. The approach works well when the market is rising slowly and mean reversion favors the patient buyer. Then the market turns. A sharp decline begins. The same traders who succeeded on the long side reach for their familiar tools and discover the rules have changed.
Markets climb on a staircase and descend in an elevator. Fear compresses time. Selling pressure feeds on itself. Attempts at mean reversion become dangerous because the downside move can accelerate far beyond what statistical bands suggest. The study revealed a clear bifurcation. The indicators that dominated long-side performance lost effectiveness on the short side. A new set of tools rose to the top—tools built for trend following rather than reversal.
This is the moment most retail traders stumble. They bring the same logic that worked when buying dips and apply it to shorting rallies or catching falling knives. The data showed that approach destroys capital. Shorting requires a different psychology and a different set of indicators. TradeSmith’s BPA research explicitly accounts for both sides of the market, delivering signals in downturns as well as uptrends—something the backtested model portfolio demonstrated across the 2022 bear market, the 2020 COVID crash, and the 2008–2009 financial crisis.
Vortex: Following the Current Without Argument
The Vortex Indicator strips away the search for extremes and asks one direct question: who is in control? It compares the strength of upward price movement against downward price movement over a chosen look-back period. When downward movement dominates, the indicator signals that the current is flowing lower.
There is no attempt to call a bottom. No clever divergence hunting. The Vortex simply identifies the prevailing direction and invites the trader to move with it. On the short side, that alignment proved exceptionally powerful. The study’s short strategies that incorporated Vortex avoided the costly habit of stepping in front of accelerating declines. Instead, they waited for confirmation that sellers were firmly in charge and then rode the momentum.
The beauty of Vortex lies in its simplicity. It does not fight the market’s emotional state; it acknowledges it. When fear is in control, the indicator stays aligned with the downtrend until evidence emerges that control has shifted. That evidence-based approach kept traders out of premature short-covering rallies and allowed them to capture extended downside moves that many reversal-based systems missed.
AI platforms can embed Vortex-style directional logic into behavioral profiles, scanning for stocks whose unique “tells” align with sustained downtrends—turning a manual filter into an automated daily short list.
Moving Averages and TRIX: The Discipline of Confirmation
Moving averages operate on a similar trend-following principle but with an even quieter voice. A crossover occurs when a shorter-term average moves below a longer-term average. That crossover does not predict a decline; it confirms that a decline has already taken hold. The distinction between prediction and confirmation is subtle yet decisive.
Most traders want to be early. They want to call the top or the bottom. That desire is expensive. The moving-average crossover forces patience. It refuses to act until the trend is already visible in the data. The study found that this enforced patience dramatically improved short-side results. Traders who waited for the crossover avoided the trap of shorting into temporary relief rallies that often follow the first leg down.
TRIX takes the concept one step further. It applies a triple exponential smoothing to the moving-average data, stripping away even more short-term noise. In a falling market, where violent counter-trend bounces are common, TRIX helps traders ignore those deceptive spikes and remain aligned with the dominant direction. The result is fewer premature exits and longer participation in the actual trend.
Together, Vortex, moving averages, and TRIX formed the core of the study’s most effective short-side strategies. They do not attempt to be clever. They simply follow the current and stay out of the way until the current changes.
TradeSmith’s examples show the power of this confirmation mindset in practice. One signal for Lam Research (LRCX) fired when the stock closed above its 200-day moving average exactly two trading days before a market holiday—producing an 11.4 percent gain in 15 days with 86 percent historical accuracy. The AI doesn’t just plot the line; it checks whether that specific timing has been a reliable “tell” for LRCX in the past.
The Quiet Power of Saying No: How Combinations Create the Real Edge
Most traders stop after identifying individual indicators. They pick one, tweak the settings, and hope for the best. The study pushed further. It asked a more sophisticated question: what happens when you only take the highest-quality signals?
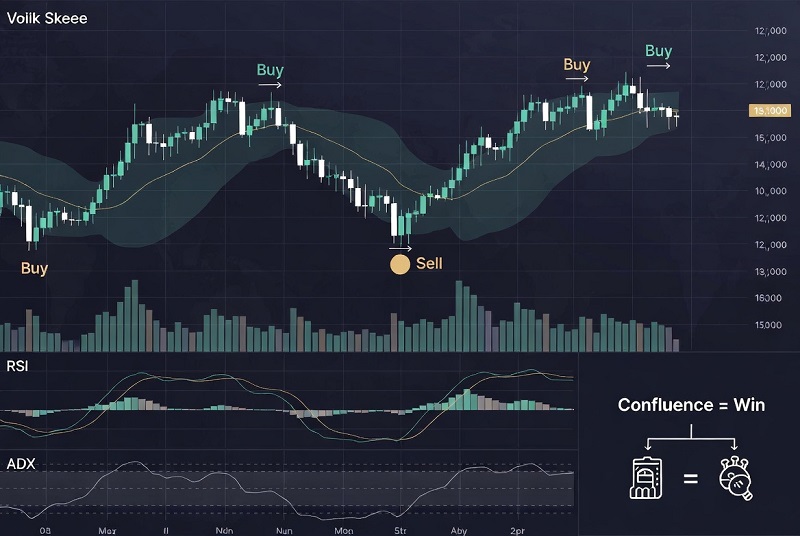
The answer lay in combinations. The structure was elegant in its simplicity. One indicator identifies a potential opportunity. A second indicator acts as a filter, deciding whether that opportunity is worth taking. The first tool might signal that price has stabilized after a stretch. The second tool then asks whether genuine momentum supports the move. If the answer is yes, the trade proceeds. If the answer is no, the trader walks away.
That single act of walking away proved to be the largest source of edge. The best-performing combinations in the study all followed this two-layer architecture:
- Bollinger Bands paired with ADX (Average Directional Index) to confirm the presence of real trend strength after stabilization.
- Bollinger Bands paired with RSI to verify that momentum was shifting in the expected direction.
- Bollinger Bands paired with money-flow indicators to ensure that volume and buying pressure supported the return to normalcy.
These pairings did not add complexity for complexity’s sake. They added discipline. They forced traders to say no to marginal setups that looked attractive in isolation but lacked confirming evidence. The data showed that the filtered versions of these strategies produced superior risk-adjusted returns precisely because they avoided the low-quality trades that dilute performance.
Signals by TradeSmith platform automates this exact filtering process at scale. It doesn’t stop at generic RSI or money flow; it builds a full behavioral profile that might combine low Bollinger bandwidth, RSI dropping below 30, rising market volatility, and even external factors like video-game sales data for AMD. One such signal for Advanced Micro Devices delivered an 8.1 percent gain in 48 hours with 95 percent historical probability—and up to 121 percent when using options. The AI continuously monitors “signal decay,” retiring combinations that stop working, exactly the kind of disciplined filtering He’s study proved creates edge.
The Part That Makes People Uncomfortable: Win Rates and the Reality of Edge
Even the strongest combinations did not win most of the time. Win rates across the top strategies clustered between 35 percent and 45 percent. That number surprises many new traders. They expect a “good” system to win 70 percent or more of the time. The study revealed the opposite. The edge resided not in frequency of wins but in the asymmetry between wins and losses. Small, controlled losses were allowed to occur. When wins arrived, they tended to be larger because the process waited for confirmation and then let trends run.
This asymmetry is how compounding actually works in practice. It is also why so many retail traders abandon systems prematurely. They experience a string of losses, lose confidence, and revert to guessing. The data-driven process demands the opposite: acceptance that you will be wrong more often than right, coupled with ironclad adherence to position sizing and risk rules so that the occasional large winner can more than offset the smaller losers.
TradeSmith’s backtested results echo this reality while amplifying the upside. Individual signals have shown historical accuracy rates of 86 percent to 95 percent or higher in specific profiles, and a one-year model portfolio using the system reportedly outperformed the S&P 500 by a factor of three. Yet the company is careful to note that past performance is no guarantee and that trading involves substantial risk of loss. The AI simply makes the high-probability setups easier to spot and the low-probability ones easier to ignore.
One Last Lesson Most Traders Will Ignore
The study took the analysis one step further by feeding the same indicators into machine-learning models. Conventional wisdom suggests that adding more variables and more sophisticated algorithms should improve results. The outcome was telling. When the models were reduced to nothing more than price and volume data, performance barely changed.
The implication is profound. Indicators do not create new information. They merely reorganize information that already exists in the price chart. The real edge lives not in the tool but in how the trader uses it. Discipline, patience, and the willingness to say no to marginal trades turned out to be far more important than any single indicator or any complex algorithm.
TradeSmith’s year-long, multi-million-dollar development project proves the point. The platform uses AI not to invent new indicators but to organize millions of combinations of existing ones into stock-specific behavioral profiles. It is the ultimate expression of He’s research: test everything, filter ruthlessly, and let the data decide.
Putting the Framework into Practice: From Manual Process to AI Signals
Translating these findings into a daily routine requires three habits. First, choose your primary setup indicator based on market direction. Use Bollinger Bands or Keltner Channels when looking for long entries after stretched moves. Switch to Vortex, moving-average crossovers, or TRIX when short-side opportunities appear. Second, always apply a confirmation filter—ADX for trend strength, RSI for momentum, or a money-flow measure to validate participation. Third, define your exit rules in advance. The same logic that governs entry should govern exit: wait for the trend to show signs of exhaustion before closing the position.
Backtesting these rules on your own historical data is non-negotiable. The study’s results were derived from decades of U.S. equity data; your broker’s platform or charting software can replicate similar tests on the instruments you actually trade. The process of testing builds confidence and reveals the small nuances that appear in live markets.
Now imagine that entire workflow running automatically every morning. That is precisely what Signals by TradeSmith delivers. The tool scans 2,467 stocks, surfaces the top five “perfect trades” each day, and provides estimated profit potential, typical duration, and success probability for every idea. Users simply type a ticker to see that stock’s unique behavioral profile and any active signals. A “boost” feature even explores leveraged options versions of the same moves.
The brand-new research behind the platform—Behavioral Profile Analysis—will be introduced live at the AI Signals Trading Event on Wednesday, April 22, at 10 a.m. Eastern Time. Hosted by TradeSmith CEO Keith Kaplan, the free event includes a market briefing, a full demonstration of the AI technology, performance context across multiple market cycles, and actionable takeaways. Attendees receive a three-part video series in advance and a special report naming two stocks aligned with the system. Best of all, registration grants immediate access to the final beta version of the software so you can test it on real stocks right away.
Risks, Limitations, and the Path Forward
No framework is perfect. Mean reversion can fail spectacularly on the short side during panic selling. Trend-following tools can lag during rapid reversals. Even the best combinations will experience drawdowns. The study itself makes no claim of perpetual outperformance. It simply identifies the approaches that historically delivered the highest risk-adjusted returns when applied with discipline. TradeSmith is equally transparent: results are historical, trading involves substantial risk, and there are no guarantees. Proper position sizing and diversification remain essential.
The greatest risk is not in the indicators or the AI. It is in the trader who reads these findings, nods in agreement, and then returns to old habits of layering indicators without testing or filtering. The market will continue to reward those who test, refine, and adhere to process. It will continue to punish those who chase certainty through opinion.
The four best trading indicators—Bollinger Bands and Keltner Channels for identifying exhausted moves on the long side, Vortex and trend tools for following sustained declines on the short side—offer a clear, evidence-based path. Combine them thoughtfully. Filter signals aggressively. Accept modest win rates in exchange for favorable reward-to-risk asymmetry. And now, with TradeSmith’s AI Signals research, you can let sophisticated behavioral profiles do the heavy lifting while you focus on execution.
Stop guessing. Start testing. And if you want to see the future of these combinations in action, claim your free spot at the AI Signals Trading Event on April 22. The tools are already on your chart—or, with one click, inside an AI platform that never sleeps. The market is waiting for your answer.
FAQ: The 4 Best Trading Indicators and Signals by TradeSmith
What are the four best trading indicators according to rigorous historical testing?
The landmark study by Fuwang He tested over 1,400 indicator strategies across decades of U.S. stock data. On the long side, Bollinger Bands and Keltner Channels stood out when used correctly — not by buying at the extremes, but by waiting for price to return inside the bands or channels after a stretch, confirming that the extreme move had lost momentum. On the short side, trend-following tools performed best: the Vortex Indicator (which identifies which direction has control), moving-average crossovers, and the TRIX oscillator. These tools excel at confirming that a downtrend is already underway rather than trying to predict reversals. The real power emerges when combining a setup indicator (e.g., Bollinger Bands) with a confirmation filter such as ADX, RSI, or money-flow measures. This disciplined “one setup + one filter” approach dramatically improved risk-adjusted returns by forcing traders to say “no” to marginal signals.
How does Signals by TradeSmith platform improve upon traditional indicator combinations?
Signals by TradeSmith platform, powered by Behavioral Profile Analysis (BPA), takes the core principles from He’s study and scales them dramatically. Instead of applying generic rules to every stock, the AI builds a unique behavioral profile for each of more than 2,467 individual stocks. It then evaluates millions of potential factor combinations every morning — including Bollinger Bands, RSI, moving averages, volume, volatility, calendar effects, sector dynamics, and even external data such as product sales or viewership metrics. The system identifies only the highest-probability alignments that have historically worked for that specific ticker. Users see the top five “perfect trades” each day, along with estimated profit potential, typical duration, and historical success probability. A “boost” feature explores leveraged options versions of the same setups. In short, it automates the filtering process that created edge in the original study while making it stock-specific and far faster than any manual approach.
Can you give real examples of how the AI combines indicators like Bollinger Bands with other factors?
Yes. One documented signal for Invesco (IVZ) fired when Bollinger Percent B and the Money Flow Index both exceeded 80 — conditions that historically delivered an 18.8% gain in just 11 days with 86% accuracy. For Advanced Micro Devices (AMD), the system combined low Bollinger bandwidth, RSI dropping below 30, and strong sales data for the video game Starfield, producing an 8.1% move in 48 hours (95% historical probability, or up to 121% with options). Another example for Lam Research (LRCX) triggered when the stock closed above its 200-day moving average exactly two trading days before a market holiday, leading to an 11.4% gain in 15 days with 86% accuracy. These examples show how the AI layers classic indicators with stock-specific “tells” that most traders would never notice manually.
What is the AI Signals Trading Event and why should I attend?
The AI Signals Trading Event is a free live virtual briefing on Wednesday, April 22, 2026, at 10:00 a.m. Eastern Time, hosted by TradeSmith CEO Keith Kaplan. It introduces the brand-new Behavioral Profile Analysis research and the Signals platform in detail, including a full live demonstration, a current market outlook, and urgent predictions for 2026. Attendees receive a three-part video series in advance (covering early signal detection, the AI technology, and performance across downturns), plus a special report naming two stocks currently aligned with the system. Most importantly, free registration grants immediate access to the final beta version of the software so you can test real signals on any of the 2,467 covered stocks right away. It is the best way to see exactly how the four best indicators are supercharged by AI and to decide whether the platform fits your trading style.
What are the realistic expectations and risks when using these indicators or the AI Signals system?
Even the best combinations from He’s study showed win rates of roughly 35–45%. The edge came from asymmetry — small controlled losses paired with larger winners — not from being right most of the time. TradeSmith’s backtested model portfolio reportedly outperformed the S&P 500 by a factor of three over one year, with individual signals showing historical accuracies of 86–95% or higher in specific profiles. However, past performance is not indicative of future results. Markets evolve, edges can decay, and even high-probability setups lose sometimes. Trading involves substantial risk of loss, including the potential for rapid drawdowns, slippage, commissions, and liquidity issues. Options trading amplifies these risks due to leverage and time decay. Neither the classic indicator framework nor TradeSmith’s AI is a guarantee or financial advice. Success requires proper position sizing, risk management, emotional discipline, and ongoing testing. Always align any strategy with your personal risk tolerance, objectives, and time horizon. The greatest danger is treating any tool — manual or AI-powered — as a “set it and forget it” solution instead of a disciplined process.