In the ever-evolving world of stock trading, where market volatility and unpredictability often reign supreme, a new offering from TradeSmith, led by CEO Keith Kaplan, promises to revolutionize how investors approach their portfolios. Dubbed “Trade Cycles,” this service leverages a unique concept called “seasonality” to identify optimal buying and selling dates for thousands of stocks, boasting an impressive 83% backtested success rate over 33 years.
With bold claims of doubling portfolios in a year and the potential to amplify gains by 5 to 10 times through options, Trade Cycles has garnered attention as potentially the most significant breakthrough in TradeSmith’s 20-year history. But is it truly Kaplan’s best service yet? This comprehensive review dives into the details of Trade Cycles, exploring its methodology, promises, and whether it lives up to the hype.
Introduction to Trade Cycles
TradeSmith, a financial technology firm founded two decades ago, has built a reputation for delivering sophisticated quantitative tools to everyday investors. Profiled by outlets like The Economist, Forbes, and The Wall Street Journal, the company has helped over 72,000 individuals globally manage $30 billion in assets.
Under Kaplan’s leadership, TradeSmith has now unveiled Trade Cycles, a service that claims to transcend traditional investing by focusing on specific calendar dates—termed “green zones” and “red zones”—when stocks historically exhibit predictable price movements.

The premise is simple yet provocative: rather than relying on conventional factors like earnings reports, valuations, or macroeconomic trends, Trade Cycles uses a proprietary algorithm to pinpoint when 5,000 stocks are most likely to rise or fall, based on patterns observed over decades.
Kaplan asserts that this approach allows investors to “ignore almost every other factor in the investment world,” making it effective in both bull and bear markets. The service promises weekly recommendations, an automated S&P 500 trading calendar, and a suite of bonuses, all aimed at empowering users to achieve outsized returns with minimized long-term risk exposure.
The Concept of Seasonality
At the heart of Trade Cycles lies the concept of “seasonality,” a phenomenon Kaplan describes as a hidden cycle influencing stock prices.
Unlike irrational data sets like pi, where no predictable pattern exists, Kaplan argues that stock market data is rational and, with sufficient analysis, reveals repetitive behaviors. These cycles, driven by human emotions such as fear, greed, and excitement, manifest as “green zones” (bullish periods) and “red zones” (bearish periods) for individual stocks.
For example, Kaplan highlights Tesla’s “green day” on May 19, where the stock has historically risen an average of 24% over 55 days with 100% accuracy over 14 years. Similarly, Nvidia’s green zone begins October 24, showing a 100% success rate over 15 years, while Allient, a lesser-known firm, rises 20% over two months starting October 28 with perfect historical consistency. On the flip side, “red zones” like Molson Coors Beverage’s, starting just days from the current date (April 1, 2025), warn of a 93% likelihood of decline.
Kaplan traces this idea back to Samuel Benner, a 19th-century farmer who, after losing his fortune in the 1873 panic, manually analyzed price data to predict market cycles. Benner’s work foresaw events like the 1893 panic and even the 2007 market top, demonstrating that seasonality is not a newfangled theory but a long-held secret exploited by elite investors. TradeSmith’s innovation lies in scaling this concept to individual stocks using modern computing power, running 50,000 tests daily across 33 years of data since 1991—the dawn of the “modern stock era.”
How Trade Cycles Works
Trade Cycles operates on a multi-faceted platform designed for accessibility and precision:
1. Algorithmic Foundation: The service’s backbone is a first-of-its-kind algorithm that analyzes 2.24 quintillion data points, rejecting results unless they achieve at least 300 positive trades for statistical significance. This algorithm, recalibrated every nine months, identifies green and red zones with an 83% overall success rate, focusing solely on seasonality rather than traditional metrics like RSI or moving averages.
2. Weekly Recommendations: Each Monday, TradeSmith’s team sifts through 500 to 1,000 potential trades, selecting 4 to 5 of the best from the top 50 high-quality companies. These recommendations include stock buys and optional call options to “boost” gains, catering to both conservative and aggressive investors.
3. S&P 500 Calendar: An automated online calendar highlights the most promising green zones for S&P 500 stocks, allowing users to trade systematically. Backtests show this model portfolio turned $10,000 into $85,700 over 18 years, outperforming the S&P 500 by 99% on average.
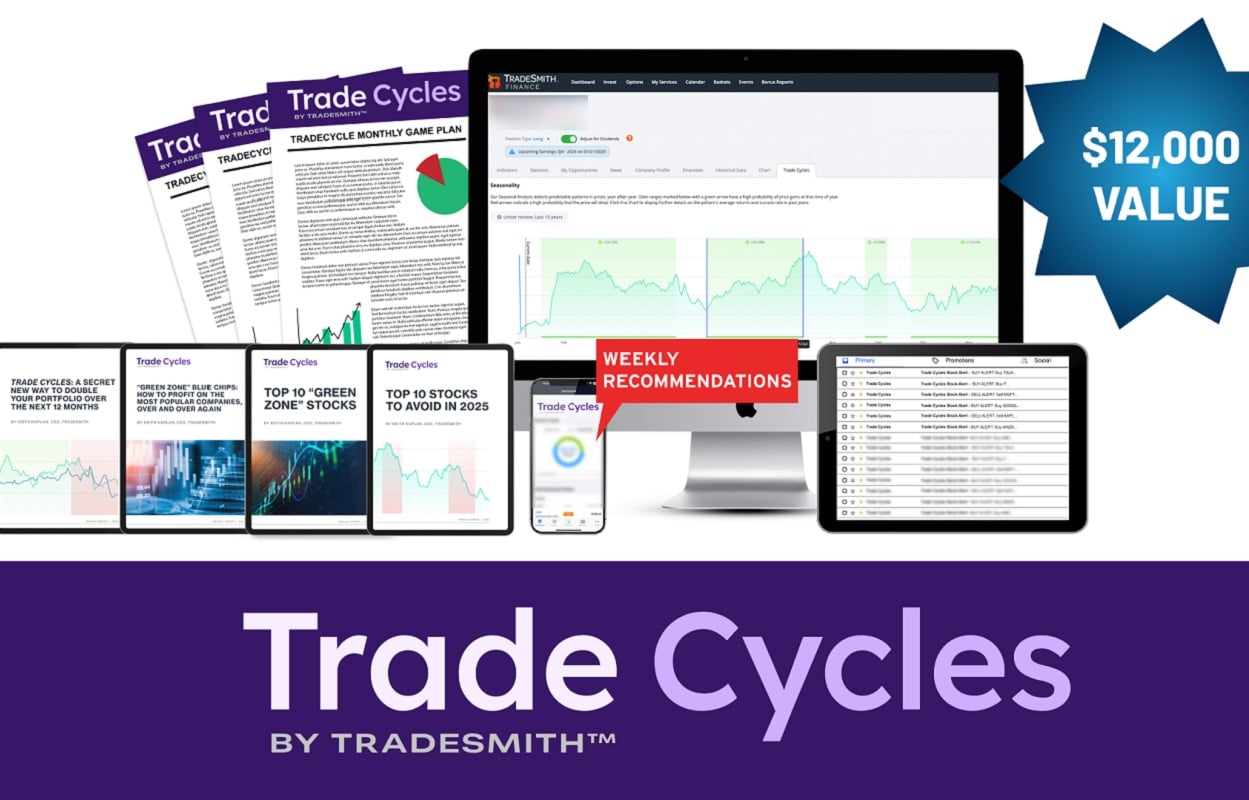
4. User System Access: Subscribers receive a year of free access to the Trade Cycles system, valued at $5,000 standalone, enabling them to input any ticker and view its seasonal patterns. Filters allow customization by success rate, market, or desired gain/loss thresholds.
5. Options Boost: For those willing to venture into options, Trade Cycles offers a “boost” feature, leveraging call options to amplify gains. Examples include a 548% return in 32 days on Eaton Corp. and an 11,340% gain in 46 days on BOK Financial, though Kaplan emphasizes starting with stock trades to build confidence.
The system’s ability to function during market downturns is a key selling point. In 2022, amidst a brutal selloff, the S&P 500 model portfolio soared, delivering gains like 617% on Entegris and 759% on Old Dominion Freight Line, all while avoiding long-term risk exposure.
The Promises and Potential
Trade Cycles makes bold promises, backed by a wealth of backtested data and user testimonials:
– Doubling Portfolios: By trading green zones consistently, Kaplan claims users can double their portfolios within 12 months. A model portfolio achieved an 857% total return over 18 years, suggesting significant upside potential.
– Options Amplification: The optional “boost” feature targets 100% to 500% gains per trade, with outliers like a 1,400% return in 4 days on Coherent Corp. demonstrating its ceiling.
– Risk Management: Unlike buy-and-hold strategies, Trade Cycles focuses on short-term trades, minimizing exposure to prolonged downturns. Kaplan predicts 2025 will see historic volatility, making this approach timely.
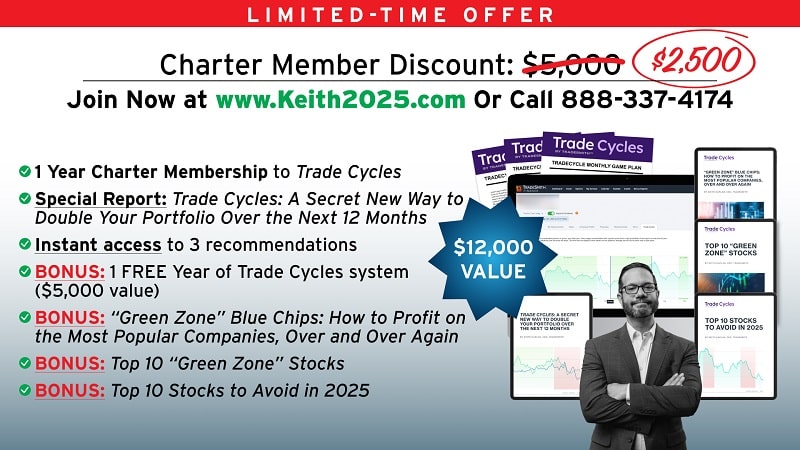
– Accessibility: Priced at $2,500 for charter members (50% off the standard $5,000), the service includes over $12,000 in bonuses, such as reports on top green zone stocks and a Master Class on options trading.
Testimonials from early users bolster these claims. One reader made $13,500 on a bitcoin ETF trade, while another doubled their investment in three weeks. Wall Street veterans like Louis Navellier and Marc Chaikin praise the system’s innovation, likening it to elite quant strategies.
The Bonuses: Enhancing Value
Trade Cycles’ charter offer includes a robust suite of bonuses, adding significant value:
1. Trade Cycles System (1 Year Free, $5,000 Value): Full access to the platform for screening stocks and viewing green/red zones.
2. Master Class: A video tutorial on seasonality and options trading, simplifying the “boost” feature for novices.
3. Trade Cycles Report: Details the strategy and system mechanics.
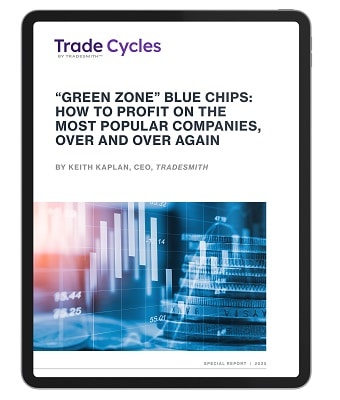
4. Green Zone Blue Chips: Highlights five blue-chip stocks with multiple green zones, like Pepsi’s 298% boosted gain in 30 days.
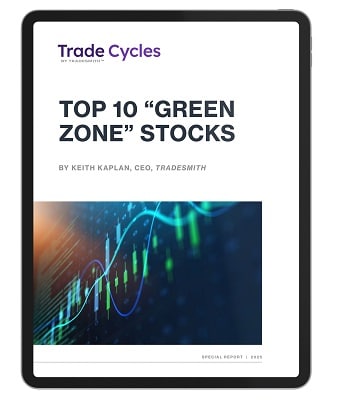
5. Top 10 Green Zone Stocks: Curates the best seasonal trades from InvestorPlace, Stansberry Research, and Oxford Club portfolios.
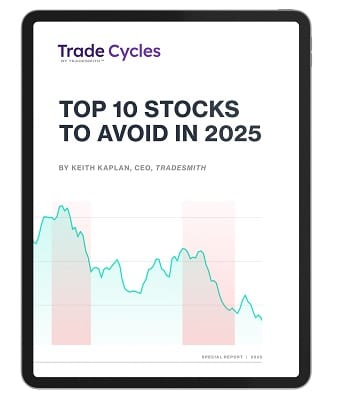
6. Top 10 Stocks to Avoid: Lists stocks with recurring red zones, such as Globalstar’s 87% drop probability.
7. Roadmap 2025: Forecasts market trends and sectors poised for gains or losses.
These extras, combined with a 90-day satisfaction guarantee (offering full credit refunds), aim to make Trade Cycles a comprehensive, risk-free proposition.
Strengths of Trade Cycles
– Data-Driven Precision: The 33-year backtest across 5,000 stocks, validated by 2.24 quintillion data loops, lends credibility to the 83% success rate.
– Market Agnostic: Success in bear markets like 2008 and 2022 underscores its resilience, appealing to risk-averse investors.
– User-Friendly Tools: The calendar and system access democratize quant-level analysis, previously exclusive to hedge funds like Renaissance (2,103,217% return since inception).
– Flexibility: Options are optional, allowing users to tailor risk levels, while weekly updates keep pace with market shifts.
– Endorsements: Praise from industry titans and user success stories enhance trustworthiness.
Criticisms and Caveats
Despite its allure, Trade Cycles isn’t without scrutiny:
– Historical Reliance: Past performance doesn’t guarantee future results, and seasonality patterns may shift, as Kaplan acknowledges with annual recalibrations.
– Options Risk: While framed as calculated, options trading carries inherent risks, potentially deterring conservative investors despite the Master Class.
– Cost: Even at $2,500, the price may be steep for casual traders, especially compared to free or low-cost alternatives.
– Overhyped Claims: Doubling a portfolio in a year assumes consistent execution and market conditions aligning with backtests, which may not always hold.
– Complexity: The sheer volume of data and tools might overwhelm beginners, despite the educational resources.
Is It Keith Kaplan’s Best Service?
TradeSmith’s portfolio includes 11 other products, many leveraging its quant platform for income generation, portfolio monitoring, and trend prediction.
Trade Cycles stands out for its singular focus on seasonality, a departure from broader strategies. Kaplan calls it his “life’s work,” integrating decades of data into a system rivaling hedge fund sophistication. Its ability to pinpoint precise trading windows, coupled with the options “boost,” offers unmatched potential upside—evidenced by gains like 11,340% on BOK Financial—setting it apart from TradeSmith’s more conventional offerings.
However, its success hinges on user adoption and market conditions. While backtests are compelling, real-world performance in 2025’s predicted volatility will be the true test.
Compared to TradeSmith’s flagship platform, praised for turning a $1.4 million loss into a $368,627 profit, Trade Cycles is more specialized, potentially limiting its universal appeal but amplifying its potency for short-term traders.
Free Recommendations and Final Thoughts
Kaplan concludes with two free picks:
– Netflix (NFLX): A green zone with a 93% success rate imminent, poised for a significant rise.
– Molson Coors Beverage (TAP): A red zone with a 93% drop likelihood, signaling avoidance.
These align with Trade Cycles’ ethos: actionable, data-backed insights delivered timely. The service’s launch timing, amidst Kaplan’s 2025 volatility forecast, positions it as a strategic tool for navigating uncertainty.
In conclusion, Trade Cycles is a bold, innovative leap for TradeSmith, blending historical wisdom with cutting-edge technology. Its promise to double portfolios and boost gains is tantalizing, supported by robust backtesting and a user-centric design.
Yet, its success depends on execution and market dynamics, making it a high-reward, moderate-risk proposition. For traders willing to embrace a new paradigm, it could indeed be Kaplan’s best service yet—but only time will tell if it transforms portfolios as promised. With a 90-day guarantee and extensive bonuses, it’s a compelling option worth exploring for 2025’s turbulent markets.
FAQ: TradeSmith Trade Cycles Review
What is Trade Cycles, and how does it work?
Trade Cycles is a new investment service from TradeSmith, led by CEO Keith Kaplan, designed to help investors double their portfolios within 12 months by trading stocks during specific, predictable periods called “green zones” and avoiding “red zones.” It uses a proprietary algorithm that analyzes 33 years of stock market data (since 1991) across 5,000 stocks to identify these seasonal patterns, boasting an 83% backtested success rate. The service provides weekly recommendations, an automated S&P 500 trading calendar, and access to a system where users can screen any stock for its optimal buy/sell dates. It also offers an optional “boost” feature using call options to amplify gains by 100% to 500% or more.
What is “seasonality,” and why is it important?
Seasonality refers to recurring cycles in stock prices driven by human emotions like fear, greed, and excitement, rather than traditional factors like earnings or news. TradeSmith’s algorithm uncovers these hidden patterns, identifying “green zones” (bullish periods) when stocks historically rise and “red zones” (bearish periods) when they fall. For example, Tesla has risen 24% over 55 days starting May 19 with 100% accuracy over 14 years. Kaplan argues that seasonality is a powerful, market-agnostic predictor, effective even during crashes, making it a cornerstone of Trade Cycles’ strategy.
How accurate is Trade Cycles’ backtesting?
Trade Cycles claims an 83% overall success rate based on a 33-year backtest covering 5,000 stocks since 1991. This involved 2.24 quintillion data tests, rejecting results unless they achieved at least 300 positive trades for statistical significance. Specific examples, like Nvidia’s 100% success rate over 15 years starting October 24, support this claim. However, past performance isn’t a guaranteed predictor of future results, and the algorithm is recalibrated every nine months to adapt to changing patterns.
Can Trade Cycles really double my portfolio in a year?
TradeSmith asserts that consistently trading green zones could double your portfolio within 12 months. A model portfolio turned $10,000 into $85,700 over 18 years, outperforming the S&P 500 by 99% on average. Success depends on executing trades as recommended and market conditions aligning with historical patterns. While testimonials—like one user doubling their investment in three weeks—support this potential, it’s not guaranteed, and individual results may vary due to risk and execution factors.
What is the “boost” feature, and is it risky?
The “boost” feature uses call options to amplify green zone gains by 100% to 500% or more, offering explosive returns like 11,340% in 46 days on BOK Financial or 1,400% in 4 days on Coherent Corp. Options carry higher risk than stocks, as they can expire worthless, but Kaplan frames them as calculated bets based on seasonality’s 83% success rate, not speculative gambling. Users can opt for stock-only trades to avoid options risk, and a free Master Class helps demystify the process.
Does Trade Cycles work in a bear market?
Yes, Trade Cycles is designed to perform in both bull and bear markets. During the 2022 selloff, its S&P 500 model portfolio delivered gains like 617% on Entegris and 759% on Old Dominion Freight Line, while the broader market crashed. Kaplan attributes this to seasonality being unaffected by external factors like earnings or recessions, citing examples like Royal Caribbean rising in 2008 despite a looming recession. The system also identifies “red zones” to avoid losses, enhancing its bear-market utility.
How much does Trade Cycles cost, and what’s included?
Normally priced at $5,000 per year, Trade Cycles offers a charter membership for $2,500 (50% off). This includes weekly trade recommendations, an S&P 500 calendar, and over $12,000 in bonuses: a year of the Trade Cycles system ($5,000 value), a Master Class, reports like “Top 10 Green Zone Stocks” and “Roadmap 2025,” and more. A 90-day satisfaction guarantee offers full credit refunds, reducing financial risk for new subscribers.
Who is Keith Kaplan, and why should I trust him?
Keith Kaplan is the CEO of TradeSmith, a financial tech firm with a 20-year history of helping 72,000+ users manage $30 billion. His work has been featured in CNN, Forbes, and The Wall Street Journal. Kaplan calls Trade Cycles his “life’s work,” building on TradeSmith’s quant expertise—like turning a $1.4 million loss into a $368,627 profit. Endorsements from Wall Street legends like Louis Navellier and Marc Chaikin bolster his credibility, though success hinges on the system’s real-world performance.
Is Trade Cycles suitable for beginners?
Trade Cycles is accessible to beginners thanks to its user-friendly calendar, system access, and educational resources like the Master Class. However, the volume of data and options trading might initially overwhelm novices. Kaplan recommends starting with stock trades to build confidence, and the 90-day guarantee allows risk-free exploration. Experienced traders may appreciate its depth, but beginners should approach it with a willingness to learn.
What are the main criticisms of Trade Cycles?
Critics note that historical backtesting doesn’t ensure future success, seasonality patterns may shift, and the $2,500 cost could deter casual investors. Options trading, while optional, carries higher risk, and the system’s complexity might challenge beginners despite support materials. Overhyped claims of doubling portfolios assume optimal conditions, which may not always materialize.
How does Trade Cycles compare to other TradeSmith services?
Unlike TradeSmith’s 11 other products, which focus on income, portfolio monitoring, or trends, Trade Cycles zeroes in on seasonality for short-term trades. It’s more specialized than the flagship platform (e.g., $368,627 profit from a $1.4 million loss) but offers higher upside potential—like 11,340% gains—making it a standout for rapid-fire traders. Its success in 2025 will determine if it’s truly Kaplan’s best service.
Why is 2026 a good time to start Trade Cycles?
Kaplan predicts historic volatility in 2026 due to earnings surprises and market dislocations, creating an ideal environment for short-term, seasonality-based trading. He argues long-term investing may falter, while Trade Cycles’ rapid in-and-out strategy could capitalize on quick gains, as seen with Intel’s 100% boosted gain in 2024 despite its struggles.
Can I get a refund if I’m unhappy?
Yes, Trade Cycles offers a 90-day 100% satisfaction guarantee. TradeSmith subscribers receive a full credit refund applicable to other products, while InvestorPlace subscribers get a credit refund for their offerings. This minimizes risk, encouraging users to test the service without long-term commitment.
Should I try Trade Cycles?
If you’re open to a data-driven, short-term trading approach and comfortable with some risk, Trade Cycles is worth considering. Its robust backtesting, market-agnostic design, and extensive bonuses make it compelling, especially for 2026’s predicted volatility. Start with stock trades, leverage the guarantee, and assess its fit for your goals—potentially Kaplan’s most innovative service yet.