As of April 1, 2025, the U.S. stock market stands at a pivotal moment, shaped by a confluence of economic policies, global trade tensions, and shifting investor sentiment.
Today’s market activity reflects a complex interplay of anticipation and reaction, primarily driven by the looming tariff announcements set for April 2—coined “Liberation Day” by President Donald Trump. With the S&P 500 navigating a turbulent first quarter, down 4.6% year-to-date, and the Nasdaq shedding over 10%, investors are grappling with uncertainty.
This article delves into the key events, trends, and data points defining the U.S. stock market on this date, offering a comprehensive summary of its performance, influential factors, and strategic opportunities. Additionally, we’ll explore two powerful investment services—Chaikin Power Portfolio and Trade Cycles—that can help investors navigate these choppy waters.
Market Overview
The backdrop to today’s market is a year that began with optimism, fueled by strong economic momentum from 2024, but quickly shifted as policy uncertainties, particularly around tariffs, took center stage. By March 31, the S&P 500 and Nasdaq had posted their worst monthly declines since late 2022, down 5.8% and 8.2%, respectively. Today, however, the market showed signs of resilience, with the S&P 500 clawing back gains after an early selloff. Let’s unpack the day’s developments and their broader implications.
Market Performance on April 1, 2025
The U.S. stock market opened April 1 with a cautious tone, reflecting the weight of impending tariff announcements. The S&P 500 started lower but rallied midday, gaining approximately 100 points from its daily low to reach around 5,650 by early afternoon, according to NYSE updates. This partial recovery, holding most of its gains by 1:30 p.m. EST, suggests a market attempting to stabilize amid uncertainty. The Dow Jones Industrial Average followed a similar trajectory, closing up 1% the previous day, while the Nasdaq Composite slipped 0.1%, underscoring tech sector weakness.
Sector performance painted a mixed picture. Consumer Discretionary and Communication Services led the gains, buoyed by travel, leisure, retail, luxury, and mega-cap tech rebounds. The NYSE FANG+ Index, tracking giants like Apple, Amazon, and Meta, rose 1%, offering a glimmer of hope for growth stocks battered earlier in the year. Conversely, Healthcare lagged, down about 1%, with pharmaceutical stocks dragging the sector lower amid regulatory shakeups, including the resignation of the FDA’s vaccine chief, Peter Marks.
Volatility remained a key theme, with the CBOE Volatility Index (VIX) hovering above 20—elevated but off its mid-March peak of 27. This “fear gauge” signals persistent investor unease, particularly as tariff details loom. The broader context shows a first quarter marked by significant declines: the Dow down 1.3%, the S&P 500 off 4.6%, and the Nasdaq down 10.5%. Tesla, a standout underperformer, lost over 35% year-to-date, hit by slumping sales and tariff-related uncertainties.
Key Influences: Tariffs and Policy Uncertainty
The dominant force shaping today’s market is the Trump administration’s tariff agenda. On March 23, reports indicated widespread reciprocal tariffs would be unveiled on April 2, targeting nations with levies on U.S. exports. Few days ago, President Trump signed an executive order imposing a 25% tariff on auto imports, effective April 3, with plans to expand to auto parts by May 3. This move hammered auto stocks last week, with ripple effects felt in markets like Germany (DAX down due to its 7% auto exposure) and South Korea.
The tariff narrative has shifted market dynamics significantly. Investors entered 2025 bullish on pro-growth policies, but the reality of trade barriers has sparked fears of inflation and economic slowdown. Goldman Sachs recently raised its U.S. recession probability to 35% from 20%, citing tariff impacts, and cut its S&P 500 year-end target to 5,700. Barclays and UBS also trimmed their 2025 forecasts, reflecting a consensus that earnings could take a hit if trade wars escalate.
Beyond tariffs, economic data added complexity. February’s consumer price index showed inflation at 3.4% year-over-year, above the Fed’s 2% target, while core PCE prices came in hotter than expected last week. Consumer sentiment hit a 32-month low of 57.0 in March, per the University of Michigan, with inflation expectations rising to 5%. Yet, durable goods orders rose 0.9% in February, and jobless claims dipped to 224,000, suggesting economic resilience. The Fed, maintaining rates at 4.25%-4.50% in January, faces a delicate balancing act as it monitors these crosscurrents.
Sector and Global Perspectives
The market’s sectoral shifts highlight a rotation away from 2023-2024’s tech-driven rally. The “Magnificent Seven” (Apple, Amazon, Alphabet, Meta, Microsoft, NVIDIA, Tesla), which soared 156.1% over two years, are down over 15% in 2025. Tesla and NVIDIA lead the losses, while the broader “S&P 493” has kept the index afloat. Consumer Staples, up 5.2% in February, and Energy, up 9.3% in Q1, signal a flight to defensive and commodity-linked sectors.
Globally, U.S. stocks underperformed. The MSCI EAFE Index, tracking developed markets, posted a 10.8% return through mid-March, outpacing the S&P 500 by 14%. Europe’s rising economic forecasts and Japan’s Nikkei 225 (down 1.48% last week due to auto tariffs) reflect divergent responses to U.S. policy. In China, the Hang Seng Index fell 1.11%, with industrial profits shrinking 0.3% year-over-year, amplifying tariff concerns.
Investment Opportunities: Recommended Services
Navigating this volatile landscape requires robust tools and strategies. Here are two recommended services to empower investors:
1. Chaikin Power Portfolio
Overview
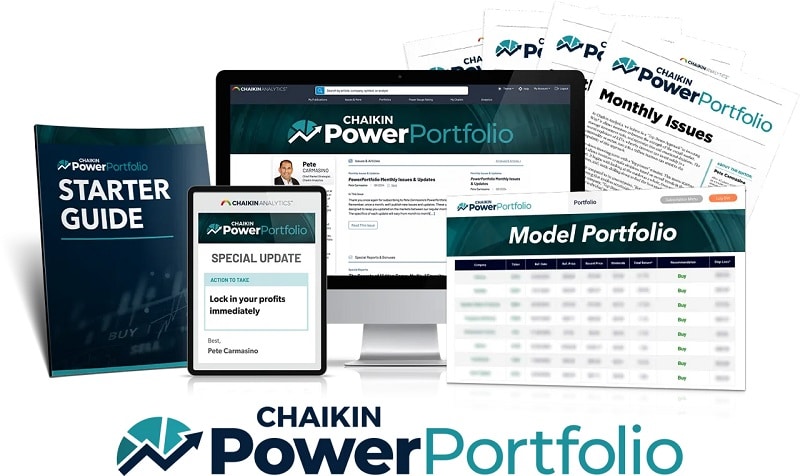
The Chaikin Power Portfolio is a new investment strategy and service launched by Chaikin Analytics, developed by Marc Chaikin and Pete Carmasino. It’s described as the “first-ever total portfolio solution” powered by the Power Gauge, an algorithm designed to predict stock performance over a 3-6 month period. The strategy aims to help investors achieve significant returns—potentially doubling or exceeding the S&P 500’s performance annually—before, during, and after market crashes, with a specific focus on preparing for a predicted crash in 2026.
Key Features
1. 90-Day Holding Periods:
– The portfolio is rebalanced every 90 days, focusing on short-term opportunities rather than long-term buy-and-hold investments. This agility allows it to adapt to market shifts, such as sector rotations or volatility.
– Pete Carmasino emphasizes selecting stocks and ETFs expected to rise within this timeframe, locking in gains quickly to avoid prolonged exposure to downturns.
2. Composition:
– Consists of 10 equal-weight positions: 5 sector/industry ETFs and 5 individual stocks.
– The ETFs (“haystacks”) are chosen from the top five ranked by the Power Gauge out of over 800 U.S. funds, targeting sectors with the highest potential to outperform over the next 90 days.
– The stocks (“needles”) are the top-performing individual stocks within each of these ETFs, selected using Pete Carmasino’s proprietary technical analysis.
3. Strategy:
– Sector Rotation Focus: Leverages the Power Gauge to identify top-performing sectors and industries amid market shifts, such as the current transition from tech to sectors like energy or healthcare.
– Risk Management: Avoids speculative investments like options or cryptocurrencies, focusing instead on a balanced portfolio of stocks and ETFs to mitigate risk while maximizing short-term gains.
– Haystack-Needle Approach: Combines broad sector exposure (ETFs) with high-potential individual stocks to optimize returns, even if some ETFs underperform.
4. Accessibility:
– Available to Charter Members for $2,500 annually (a 50% discount from the standard $5,000 price), with immediate access to current recommendations upon joining.
– Includes monthly updates from Pete Carmasino and tools like Power Gauge Pro for tracking performance.
Performance Claims (Backtested Results)
– Seven-Year Backtest (2018-2024):
– Average annual return: 37%, compared to the S&P 500’s 15%.
– Would have turned $100,000 into **$876,000** by the end of 2024, versus $243,000 in an S&P 500 ETF or $184,000 for the average investor.
– Beat the S&P 500 every year, including during bullish years (e.g., 55% vs. 24% in 2024) and bearish years (e.g., positive return vs. -18% S&P in 2022).
– Specific Examples:
– 2022 Bear Market: Delivered gains like 31% in Consol Energy (Q2) and 30% in Biogen (Q3) while the S&P fell 16% and 5%, respectively.
– 2020 COVID Crash: Offered nine 20%+ winners in Q2, ending the year up 48% vs. the S&P’s 18%.
– 2018 Volatility: Achieved a 19% return vs. the S&P’s -4%.
– Risk-Adjusted Performance:
– Sortino Ratio of 4.62, indicating “beyond excellent” returns relative to risk, far surpassing typical portfolio management benchmarks.
Tools and Bonuses
– Power Gauge Pro: A customized version (valued at $5,000) included free for Charter Members, featuring the **Chaikin Portfolio List** tool to track holdings and compare performance to the S&P 500.
– Discovery Engine: A bonus tool (valued separately) that recommends stocks similar to user favorites, e.g., suggesting Dream Finders Homes (up 256%) over Tesla (up 33%) in 2023.
– 10 Ticking Time Bombs: A quarterly blacklist of the 5 worst ETFs and stocks to avoid, e.g., Invesco Wilder Hill Clean Energy Fund (PBW) and Tesla (TSLA) as of now.
– Stansberry’s Top 10 Tailwind Stocks: A $2,000-valued report with top picks from Stansberry Research, screened by the Power Gauge.
Purpose and Market Context
– Designed to capitalize on the current “historic sector rotation” and prepare for a predicted “crash of epic proportions” in 2026, tied to the presidential election cycle’s midterm bust phase.
– Aims to outperform the average investor, who historically underperforms the S&P 500 (e.g., -21% vs. -18% in 2022), by offering a systematic, data-driven approach.
Caveats
– Backtested Nature: Results are hypothetical, based on historical data, and not a guarantee of future performance.
– Risk: While less speculative than options, losses are possible (e.g., -20% and -23% in Q1 2020), though the strategy still outperformed the market in such scenarios.
– No Refunds: Offers a 30-day satisfaction guarantee with credit toward other Chaikin products, not cash refunds.
In summary, the Chaikin Power Portfolio is a structured, short-term investment model leveraging the Power Gauge to target high-performing sectors and stocks every 90 days, aiming to deliver consistent market-beating returns with a focus on simplicity and adaptability. It’s positioned as a proactive solution for navigating the volatile market conditions expected through 2025 and beyond.
Want to learn more about Chaikin Power Portfolio? Read our Chaikin Power Portfolio review here.
2. Trade Cycles
Overview
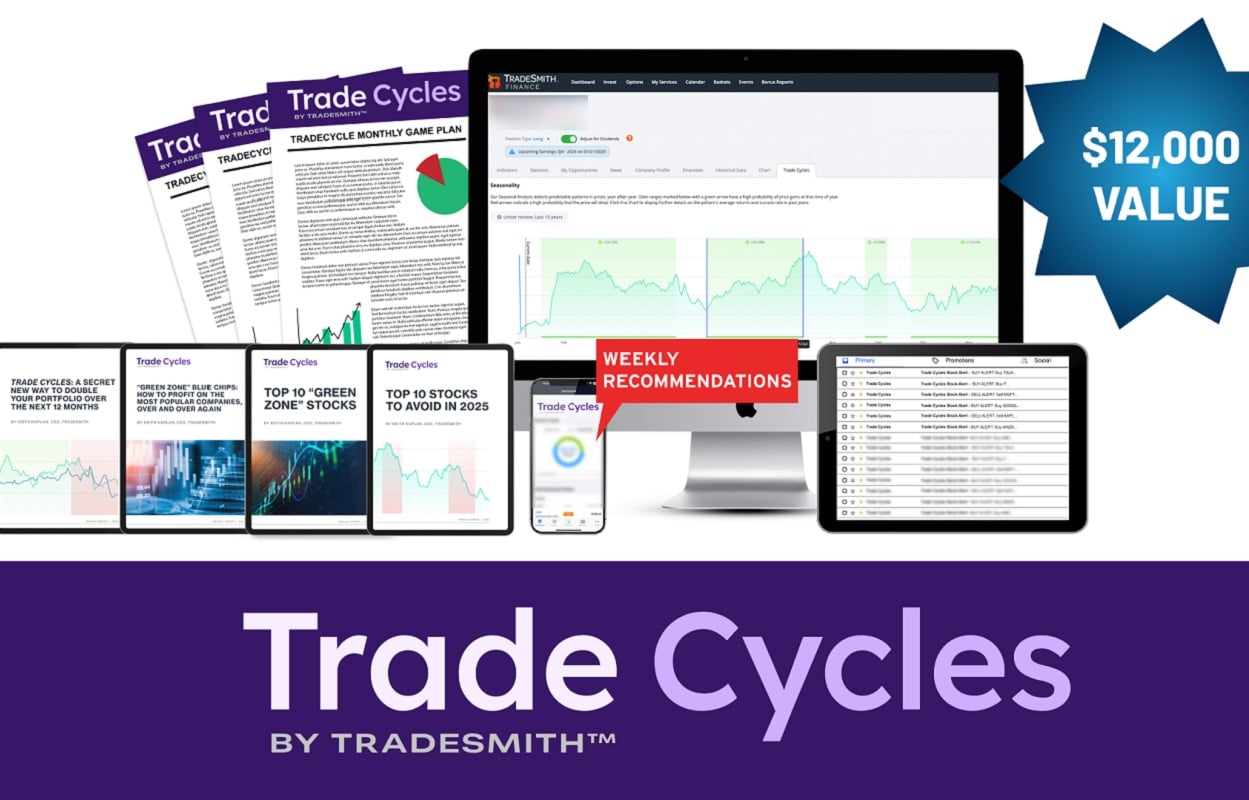
Trade Cycles is a new investment strategy and subscription service launched by TradeSmith, led by CEO Keith Kaplan. It’s presented as a groundbreaking approach to stock trading, leveraging a proprietary algorithm to predict specific dates—termed “green days” and “red days”—when individual stocks are likely to rise or fall, based on historical patterns. The system aims to help investors double their portfolios within 12 months by trading these predictable short-term “zones,” regardless of broader market conditions, with an 83% backtested accuracy rate across 33 years of data.
Key Features
1. Green Zones and Red Zones:
– Green Zones: Specific calendar dates when a stock historically rises, identified as the optimal time to buy.
Examples include:
– Tesla: May 19, up 24% in 55 days (100% success rate over 14 years).
– Netflix: January 16, up 19% in 81 days (93% success rate).
– Amazon: November 13, up 4% in 15 days (86% success rate).
– Red Zones: Dates when a stock historically falls, signaling times to sell or avoid.
Examples include:
– Wynn Resorts: May 2, down 10% in 55 days (93% success rate).
– Molson Coors: Upcoming red zone with a 93% success rate (specific date not detailed).
– These zones are short-term, typically lasting days to weeks (e.g., 15-90 days), allowing rapid trades.
2. Seasonality as the Core Principle:
– The system hinges on “seasonality,” a repetitive pattern in stock price movements tied to specific dates, driven by human emotion rather than fundamental factors like earnings or news.
– Unlike traditional analysis, it ignores conventional metrics (e.g., earnings, valuation, technical indicators) and focuses solely on historical cycles.
3. Scope and Scale:
– Applies to 5,000 stocks across the Dow, S&P 500, and Nasdaq, with backtesting from 1991 to present (33 years).
– Analyzes over 2.24 quintillion data points, running 50,000 tests daily, recalibrated every 9 months to adapt to changing patterns.
4. Trading Frequency:
– Recommends 4-5 trades per month from a pool of 500-1,000 annual opportunities, selecting only the top 50 high-quality stocks with the strongest green zones.
– Offers an online calendar for S&P 500 stocks, updated weekly, showing optimal buy/sell dates.
5. Boost Feature (Options):
– Enhances gains by 100%-500%+ using call options during green zones, targeting stocks with high historical success rates (e.g., 87%-100%).
– Examples:
– Eaton Corp: 9.6% stock gain boosted to 548% in 32 days (2016).
– BOK Financial: 9.8% stock gain boosted to 11,340% in 46 days.
– Emphasizes calculated, low-risk options trading, not speculative gambling.
Subscription Details
– Cost: $5,000/year standard, discounted to $2,500/year for charter members (50% off).
– Components:
- – Weekly trade recommendations (4-5/month).
- – Online calendar for S&P 500 green/red zones.
- – Access to the Trade Cycles system ($5,000 value, free for 1 year).
- – Bonuses: Reports (e.g., Top 10 “Green Zone” Stocks, Top 10 Stocks to Avoid in 2025), Options Master Class, Roadmap 2025.
– Guarantee: 90-day satisfaction guarantee with full credit refund toward other TradeSmith or InvestorPlace products.
In summary, Trade Cycles is a quant-driven, seasonality-based trading system designed to pinpoint precise buy/sell dates for 5,000 stocks, offering rapid, repeatable gains (amplified via options) with an 83% backtested success rate. It positions itself as a risk-managed alternative to long-term investing, tailored for 2025’s predicted volatility, with a robust suite of tools and historical validation.
Want to learn more about Trade Cycles? Read our in-depth Trade Cycles review here.
Looking Ahead: What’s Next for the Market?
April 2’s tariff announcement will be a defining moment. If less severe than feared, a “buy the news” rally could emerge, as suggested by Harris Financial Group’s Jamie Cox. However, retaliatory measures from allies like Canada or the EU could trigger an escalatory cycle, dampening optimism. Key data this week—ISM Manufacturing PMI, nonfarm payrolls (expected at 130,000 jobs)—will further shape sentiment. Fed Chair Jerome Powell’s Friday remarks could also clarify rate cut prospects, with markets pricing in just two for 2025.
Longer term, analysts remain cautiously optimistic. BlackRock sees AI and deregulation boosting growth, while Charles Schwab highlights the S&P 500’s historical 9.2% annualized gain when above its 200-day moving average—a position it holds today. Yet, high valuations and policy risks suggest a bumpy ride ahead.
Conclusion
On April 1, 2025, the U.S. stock market reflects a nation—and a world—in transition. Tariffs, inflation fears, and sector rotations dominate the narrative, yet pockets of resilience emerge. The S&P 500’s midday recovery underscores a market seeking footing, while global outperformance and defensive shifts signal broader adaptation. Services like Chaikin Power Portfolio and Trade Cycles offer investors tools to thrive amid this complexity, blending analytics, innovation, and timing. As “Liberation Day” looms, staying informed and agile is paramount—today’s market is a proving ground for strategic resilience.
FAQ: U.S. Stock Market and Investment Services – April 1, 2025
What’s happening in the U.S. stock market on April 1, 2025?
The U.S. stock market is experiencing volatility due to anticipation of tariff announcements set for April 2, dubbed “Liberation Day” by President Trump. The S&P 500 is down 4.6% year-to-date, and the Nasdaq has dropped over 10%. On April 1, the S&P 500 rallied midday, gaining about 100 points to reach 5,650, while the Dow rose and the Nasdaq slipped slightly, reflecting mixed sector performance amid uncertainty.
Why are tariffs such a big deal right now?
Tariffs are driving market dynamics due to Trump’s planned 25% tariff on auto imports (effective April 3) and broader reciprocal tariffs targeting nations taxing U.S. exports, set to be detailed on April 2. These policies raise fears of inflation, trade wars, and economic slowdown, prompting Goldman Sachs to increase its U.S. recession odds to 35% and cut its S&P 500 target to 5,700.
How have major indices performed in 2025 so far?
As of April 1, the first quarter has been rough:
- S&P 500: Down 4.6% year-to-date, with a 5.8% drop in March.
- Nasdaq: Down 10.5%, with an 8.2% decline in March.
- Dow: Down 1.3%, showing relative resilience. Tech stocks like Tesla (down 35%) have been hit hard, while defensive sectors like Consumer Staples and Energy have gained.
What is the Chaikin Power Portfolio, and how does it work?
The Chaikin Power Portfolio, launched by Chaikin Analytics, is a service using the Power Gauge algorithm to predict stock performance over 3-6 months. It rebalances every 90 days with 10 equal-weight positions (5 ETFs, 5 stocks) to capture short-term gains. It aims to beat the S&P 500 annually, with a backtested 37% average return (2018-2024), turning $100,000 into $876,000 vs. $243,000 for the S&P 500.
What is Trade Cycles, and how does it differ?
Trade Cycles, from TradeSmith, uses a seasonality-based algorithm to predict “green zones” (buy) and “red zones” (sell) for 5,000 stocks, based on 33 years of data with an 83% success rate. It recommends 4-5 trades monthly and offers options to boost gains (e.g., 548% in 32 days). Unlike Chaikin’s 90-day focus, Trade Cycles targets shorter windows (days to weeks) and ignores fundamentals.
How much do these services cost?
- Chaikin Power Portfolio: $5,000/year standard, $2,500/year for charter members (50% off).
- Trade Cycles: $5,000/year standard, $2,500/year for charter members. Both include tools and bonuses, with satisfaction guarantees (30 days for Chaikin, 90 days for Trade Cycles, credit refunds only).
Can these services help in the current market?
Yes, both are designed for volatility:
- Chaikin Power Portfolio: Focuses on sector rotation and risk management, preparing for a predicted 2026 crash.
- Trade Cycles: Targets short-term opportunities, thriving in choppy markets like 2025’s tariff-driven uncertainty, with rapid trades and options boosts.
Are the performance claims guaranteed?
No, both rely on backtested results:
- Chaikin: 37% annual return (2018-2024) is hypothetical; losses occurred (e.g., -20% in Q1 2020).
- Trade Cycles: 857% over 18 years (2006-2024) and 83% accuracy are backtested, not live trades. Future results may vary.
What’s the outlook after April 2’s tariff announcement?
It depends on the details. A milder-than-expected policy could spark a rally, per Harris Financial Group. Escalation with allies like the EU or Canada might dampen sentiment. Upcoming data (ISM PMI, payrolls) and Fed Chair Powell’s remarks will also influence markets, with analysts cautiously optimistic long-term despite risks.
Which sectors are performing best or worst right now?
- Best: Consumer Discretionary, Communication Services (e.g., NYSE FANG+ up 1%), Consumer Staples (+5.2% in Feb), Energy (+9.3% Q1).
- Worst: Healthcare (down 1%), tech-heavy Nasdaq (Tesla down 35%), and growth stocks (Magnificent Seven down 15% YTD).
How volatile is the market on April 1?
The VIX is above 20, indicating elevated unease but below its March peak of 27. This reflects persistent uncertainty around tariffs, inflation (3.4% in Feb), and consumer sentiment (32-month low of 57.0).
Should I invest now or wait?
It depends on your strategy. Chaikin Power Portfolio suits those seeking 90-day gains amid rotation, while Trade Cycles fits rapid traders eyeing specific dates. Analysts suggest agility—April 2’s outcome could shift sentiment fast, with BlackRock and Schwab seeing long-term growth potential despite near-term bumps.
