When the Fed changes direction, the ripple effects across the stock market can be dramatic. Some stocks stumble, others take off — and history shows the gap between winners and losers can be massive.
Key Takeaway Q&A
Q: Why do rate cuts matter for stocks?
A: Cheaper borrowing, stronger liquidity, and rising investor confidence often follow. Historically, the S&P 500 has gained after rate cuts near highs.
Q: Do all stocks rise equally?
A: No. Some collapse while others double or more. Rate cuts favor certain sectors and companies.
Q: What’s the pattern most investors miss?
A: Joel Litman calls it the Doubles Anomaly: stocks that already doubled have a high chance of doubling again, especially when the Fed cuts.
Q: Which sectors look best now?
A: Tech (AI, semiconductors), biotech, and capital-intensive growth companies stand out.
Q: How can I spot the next winners?
A: Tools like Litman’s Breakout Screener and Altimeter Pro help identify stocks in the Breakout Zone — the sweet spot for repeat gains.
Rate cuts always create new stories in the market — some obvious, others hidden in plain sight. Let’s start by looking at why today’s expected cut could matter more than most.
Why Rate Cuts Change Everything
The Federal Reserve doesn’t just guide interest rates. It guides expectations. Investors, businesses, and households all watch the Fed as a signal for where money is going and how easy it will be to access.
A rate hike tells the market: tighten your belt.
A rate cut says: loosen up.
That’s why this moment matters. The Fed has been holding rates high to keep inflation in check. But with growth cooling and debt costs weighing on households and companies, pressure has been mounting to ease. If today’s expected cut goes through, it won’t just be a policy shift. It will be a message — and markets will move on it.
The historical playbook
History suggests this kind of setup tilts in favor of stocks. According to Carson Research, each time the Fed has cut rates while the S&P 500 was near record highs, the index was higher a year later. Not most of the time. Every single time.
That’s 20 out of 20. With an average gain of nearly 14%.
But averages can be misleading. One stock doubles, another tanks, and the “average” sits in between. Your portfolio isn’t an average. It’s a set of choices. That’s why it matters to look deeper.
Not all boats rise with the tide
Think back to 2023. The market was up big — more than 20% for the year. But Walgreens collapsed more than 60%. Palantir surged more than 300%. Both were in the same index. Both were exposed to the same macro tailwinds. But their stories couldn’t have been more different.
That’s the lesson. Rate cuts create opportunities, but not every stock participates equally. Some are ready to benefit. Others are vulnerable.
Why this cut feels different
This isn’t a clean economic backdrop. Inflation hasn’t fully cooled. Unemployment is low, but cracks are appearing in consumer spending. The market is near highs, but many investors remain uneasy, scarred by the volatility of the past few years.
That hesitation could be fuel. When fear lingers, capital doesn’t flood the market all at once. It trickles, then accelerates, often into the strongest names. That’s when you see breakouts.
Enter the anomaly
This is where Joel Litman’s work connects. He’s identified a pattern — the Doubles Anomaly. It shows that about half the stocks that double once go on to double again, provided their fundamentals and momentum align.
And what often acts as the trigger? A shift like today’s — when money gets cheaper, confidence rises, and investors look for the next leg higher. Litman calls this window the Breakout Zone. It’s the moment when a stock’s story, numbers, and market conditions converge.
With a rate cut expected, the door to that zone may open wider than it has in years.
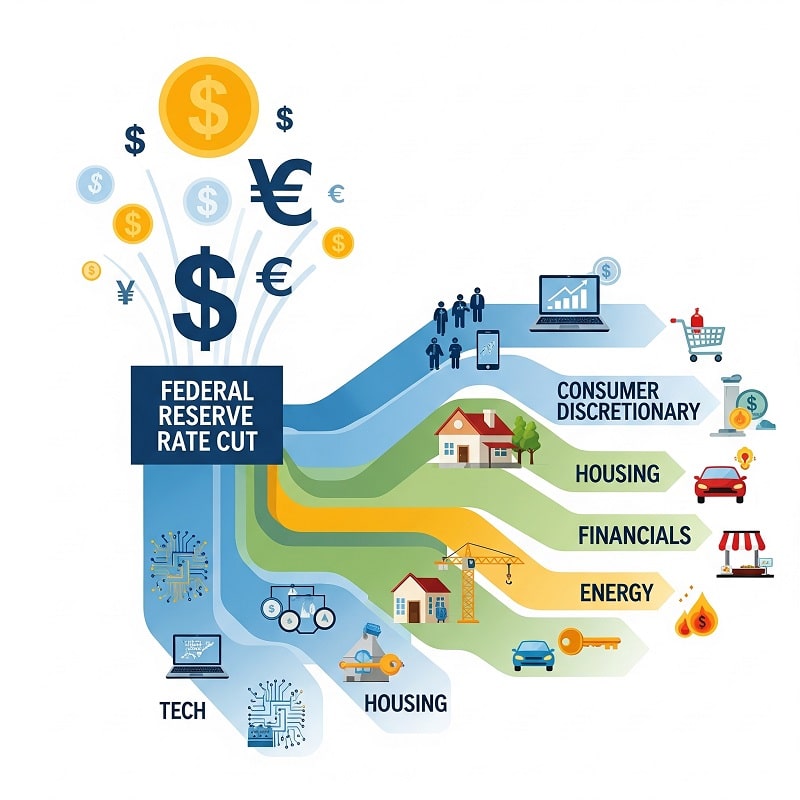
Sectors That Historically Thrive After a Rate Cut
Not all parts of the market respond the same way when the Fed cuts rates. Some sectors tend to absorb the benefit faster, while others lag or even weaken.
Why? Because interest rates change two things at once: the cost of borrowing and the value investors assign to future earnings. Put simply, a cut makes debt cheaper and tomorrow’s profits look more attractive in today’s terms. That’s why certain industries consistently stand out.
Technology: the clear beneficiary
Tech is almost always near the top of the list. Companies in this space thrive on growth narratives. They borrow to fund expansion. They trade on high multiples because investors are betting on tomorrow’s profits, not today’s.
When rates fall, those bets look more appealing. A dollar earned five years from now is worth more when discounted at a lower rate. Suddenly, the premium valuations on software, AI, and semiconductor stocks don’t look so stretched.
That’s part of why the Nasdaq often outperforms in easing cycles. Consider the period after the 2001 dot-com bust: once the Fed began slashing rates, tech staged a recovery that carried leaders like Apple and Microsoft into their next growth phases. More recently, in 2020, the massive cuts tied to the pandemic set off an extraordinary run in cloud computing and digital services.
The same logic could apply now. Artificial intelligence, chip design, and enterprise software are all capital-hungry fields. With cheaper money, the leaders in these spaces often surge ahead.
Financials: not always straightforward
Banks and lenders react differently depending on the starting point. Rate cuts shrink net interest margins, which can squeeze profits. But if cuts revive borrowing demand, that loss can be offset by growth in loan volumes.
Historically, regional banks benefit when credit conditions improve. Brokerages and asset managers often see inflows as investors reallocate toward equities. Insurance companies, on the other hand, sometimes struggle because their investment income falls alongside rates.
The key here is selectivity. Not every financial stock wins. The ones that do usually have diversified revenue streams and strong ties to capital markets.
Real estate and housing: clear beneficiaries
Lower rates mean cheaper mortgages. That’s a direct tailwind for housing. Builders, suppliers, and real estate developers often see activity pick up when borrowing becomes more affordable.
Think back to 2009–2012. The Fed’s zero-rate policy and quantitative easing fueled one of the strongest rebounds in housing demand after the financial crisis. Homebuilders like Lennar and D.R. Horton posted steady gains as demand came back online.
The same is true for commercial real estate investment trusts (REITs). Lower financing costs improve profitability, and lower bond yields make dividend-paying REITs more attractive by comparison.
Industrials and capital goods: cyclical lift
Industrials are highly sensitive to credit conditions. Building new factories, expanding logistics networks, or investing in heavy equipment often requires borrowing. When that cost falls, activity accelerates.
Caterpillar, Honeywell, and other capital goods giants often outperform early in easing cycles. Their order books grow as companies feel more confident about financing expansion. Infrastructure spending, manufacturing upgrades, and global trade flows all benefit.
Consumer discretionary: credit-driven demand
Households also feel the effect of cheaper money. Lower rates mean lower credit card interest, auto loans, and personal loan costs. That gives consumers more room to spend — particularly in discretionary categories like travel, retail, and dining.
After the Fed’s cuts in 2019, consumer discretionary stocks outperformed as Americans spent freely on e-commerce and leisure. Post-2020, the “revenge travel” boom was fueled in part by cheap money that helped consumers absorb higher prices.
Of course, this depends on confidence. If rate cuts come during a recession, consumers may save the benefit instead of spending it. But when the economy is steady, cuts often unlock discretionary demand.
Healthcare and biotech: funding tailwinds
Biotech is one of the most obvious winners. Developing drugs requires capital. When money is expensive, early-stage biotech firms struggle. When money is cheap, funding pipelines reopen.
This is why many biotech rallies line up with easing cycles. Investors are more willing to fund long-term projects when the opportunity cost of capital is low. The 2010s bull run in biotech was fueled in part by years of easy money.
Healthcare more broadly benefits too, but for different reasons. Defensive demand makes it attractive when volatility rises, and lower discount rates boost the valuations of long-term cash flows in the sector.
Energy and commodities: a nuanced story
Energy stocks don’t always benefit directly from rate cuts. But if cuts spur global growth, demand for oil, gas, and metals often rises. Producers, refiners, and miners can ride that wave.
In 2003–2007, Fed easing helped fuel a global commodity supercycle, with energy and metals stocks soaring. Today, with clean energy and electrification trends accelerating, the beneficiaries might not just be oil majors but lithium producers, solar companies, and utilities investing in renewables.
The Joel Litman connection
All of this points to opportunity. But here’s the catch: even within the strongest sectors, the dispersion is wide. One biotech stock might double while another flatlines. One software firm might soar while another fades into irrelevance.
That’s where Joel Litman’s Doubles Anomaly becomes so relevant. Rate cuts don’t lift every boat. But they often act as the spark for those already on the verge of another leg higher. Identifying which names are in the “Breakout Zone” can mean the difference between catching a stock that doubles — or missing it entirely.
The Historical Playbook of Rate-Cut Rallies
Markets have short memories. Every cycle feels unique when you’re in the middle of it, but the truth is, the Federal Reserve has been down this road plenty of times before. And each time, investors faced the same questions:
-
Does a rate cut mean stocks are about to rip higher?
-
Or is it a sign the economy is already slowing too much?
-
Should you go all-in on growth, or hedge for trouble?
The answers vary by cycle, but patterns emerge when you step back. Let’s walk through a few of the most telling examples.
The early 1980s: taming inflation, fueling recovery
Back then, Paul Volcker’s Fed was fighting runaway inflation. To crush it, rates had been pushed above 15%. When cuts finally began, investors were nervous: Was the economy too fragile, or was relief on the way?
Turns out, the cuts marked the start of one of the most powerful bull runs in history. From 1982 through the rest of the decade, equities surged as inflation cooled and growth stabilized. Industrials and consumer stocks led the charge, but almost everything got a lift.
The lesson: even sharp rate cuts can signal not just fear, but opportunity. Once the pivot is clear, investors often reposition quickly.
1995–1999: the prelude to the dot-com boom
The mid-1990s are a textbook case. The Fed had tightened aggressively in 1994. By 1995, it switched course, easing conditions again.
What followed was a four-year bull run that carried the S&P 500 to then-unprecedented highs. Technology and telecom stocks dominated, powered by cheap credit and investor optimism about the internet’s future.
Yes, the bubble eventually burst. But the gains between the cuts and the peak were real — and huge for anyone positioned early.
2001–2003: cushioning the dot-com bust
When the tech bubble collapsed, the Fed slashed rates to soften the blow. At first, stocks kept falling. The Nasdaq in particular was crushed, losing nearly 80% from peak to trough.
But by late 2002 into 2003, the seeds of recovery had been planted. Lower borrowing costs set the stage for a rebound. Housing, industrials, and eventually tech rebounded. Those who stuck around through the pain — or re-entered at the right time — saw meaningful gains.
Here, the playbook shows that timing matters. Rate cuts don’t always stop a crash immediately, but they often build the floor beneath the next bull.
2008–2009: from crisis to recovery
The Global Financial Crisis is etched into memory. The Fed’s rate cuts began in 2007, but the crisis deepened anyway. For many, it was proof that cuts “don’t work.”
But look at the bigger picture: by March 2009, when stocks bottomed, the Fed had already pushed rates to zero and launched quantitative easing. The S&P 500 then more than tripled over the next decade.
The takeaway? Rate cuts aren’t magic. They don’t erase structural problems overnight. But they do create the foundation for recovery, which often delivers massive returns once panic subsides.
2019–2020: cuts before a shock, then the pandemic response
In 2019, the Fed cut rates three times as trade tensions and slowing growth loomed. The market rallied hard into early 2020, reaching fresh highs.
Then the pandemic hit. Stocks collapsed, and it seemed the cuts had been meaningless. But once the Fed doubled down — slashing rates to zero and flooding markets with liquidity — the rebound was breathtaking. Tech, biotech, and consumer discretionary stocks ripped higher, delivering triple-digit returns in some cases.
The pattern repeated: rate cuts alone don’t guarantee smooth sailing. But they usually tilt the odds toward higher valuations once uncertainty eases.
What the record really says
Put it all together, and a clear pattern emerges:
-
The short-term reaction to a cut can be messy. Sometimes stocks dip, sometimes they spike.
-
The medium- to long-term reaction skews positive, especially when cuts come from relatively normal levels, not during a full-blown crisis.
-
Leadership changes. Some cycles favor tech, others housing or industrials. But there are always winners — if you know where to look.
And that’s where today’s situation gets interesting. The S&P 500 is near all-time highs. Cuts at this altitude have historically been bullish — every single time, the index finished higher a year later. That’s not my data; it’s from Carson Research. Twenty out of twenty times.
But averages can be misleading. As Joel Litman points out, no stock is “average.” During last year’s S&P surge, Walgreens dropped 64% while Palantir gained over 300%. Same market, wildly different outcomes.
That’s why understanding history is valuable, but not enough. You also need a way to filter for the stocks most likely to outperform this time. And according to Joel, his “Breakout 2025” framework is designed to do exactly that — pinpointing the anomalies that separate the winners from the laggards.
Why This Time Feels Different — and Why It Might Not Be
Every cycle has its chorus of “this time is different.” Sometimes it’s true, at least in the details. But more often, the patterns rhyme more than investors want to admit.
Right now, the setup looks unusual for a few reasons.
Valuations are stretched
The S&P 500 has been hovering near record highs, with forward P/E ratios above long-term averages. Investors look around and think: How much higher can it go?
That’s a fair question. When stocks are already expensive, a rate cut can feel like adding fuel to an already overheated fire. The instinct is to assume the bubble must pop soon.
But here’s the flip side: high valuations haven’t stopped markets from climbing in past cycles. The late 1990s were “expensive” by almost every measure, yet stocks doubled and doubled again before the dot-com crash. Expensive can always get more expensive when liquidity floods the system.
Inflation isn’t fully tamed
This isn’t 2009, when deflation fears dominated. Inflation is still a real risk today, even if the official numbers show cooling. Energy costs remain volatile, wages are sticky, and supply chains aren’t immune to new shocks.
Cutting rates in this context feels risky. If inflation perks up again, the Fed may have to reverse course, which could jolt markets. That uncertainty makes some investors nervous.
Still, history reminds us that markets can thrive even with inflation in the background, as long as credit is flowing and earnings look solid.
The global picture is messy
Geopolitical risks — from wars to trade disputes to supply chain disruptions — add another layer of unpredictability. Europe is teetering on slow growth, China is wrestling with its property market, and emerging markets are balancing debt and currency challenges.
This interconnectedness makes “this time” feel more fragile. Yet the market has powered through global turbulence before. The 1990s had currency crises in Asia and Russia. The 2010s had Europe’s sovereign debt drama. Neither derailed U.S. equities for long.
Technology is front and center
One thing that is unique now is how dominant technology has become in market leadership. AI, semiconductors, cloud computing, and biotech advances aren’t just stories — they’re shaping earnings and productivity in real time.
A rate cut amplifies that trend. Growth companies that need capital to expand benefit most from cheaper borrowing costs. And in today’s market, many of those companies sit squarely in the tech sector.
The “different but not different” paradox
So, is this time truly different? In the details, yes. The players, the politics, the industries in the spotlight — they’re all shaped by today’s world.
But the broad strokes echo the past. Rate cuts from elevated levels near market highs have consistently been followed by gains over the next year. Sectors shift, winners change, but the core relationship between easier money and rising equity prices tends to hold.
And here’s the kicker: averages hide the outliers. Even if the S&P climbs 10–15%, there will be stocks that fall hard — and others that double or more. The challenge is separating them.
That’s exactly why Joel Litman is hammering on the Doubles Anomaly. His point is simple: the best odds of spotting repeat winners come from identifying companies that already proved they can double — and are entering what he calls the Breakout Zone. Rate cuts act as an accelerant, pushing those stocks further than most investors expect.
Which raises the practical question: where should you actually look right now?
Where Investors Should Look Right Now
If rate cuts are fuel, the question becomes: which engines are most ready to roar? Not every sector responds the same way. Some thrive almost immediately. Others take time. And a few barely move at all.
Here’s where investors should keep their eyes today.
Technology: the front-runner
Tech is usually first in line when borrowing costs fall. Companies in AI, semiconductors, and cloud infrastructure are capital-intensive. They burn through cash to expand, build, and innovate. Lower interest rates reduce that burden.
And it’s not just about debt. Rate cuts often drive investors back into “long-duration” assets — stocks whose value comes more from future earnings than today’s profits. That’s almost the textbook definition of growth tech.
Take semiconductors. Demand for chips is rising across industries: cars, data centers, AI, consumer electronics. Cheaper capital means faster buildouts, which means more sales, which often pushes valuations higher.
This is why names like Nvidia or AMD can double in a year when the conditions line up. And Joel Litman’s work highlights how companies that already had big runs often have more gas left in the tank than people assume.
Biotech: a quiet beneficiary
Biotech isn’t always in the headlines, but it benefits hugely from rate cuts. These firms rely on heavy upfront research costs, often without steady revenue streams until they hit approval milestones. Cheaper money keeps the funding window open longer.
Historically, biotech has staged monster rallies in post-cut environments, especially when paired with breakthrough technologies or favorable regulatory news. The COVID-19 period is a reminder: biotech went from ignored to essential almost overnight.
Right now, gene editing, oncology therapies, and weight-loss drugs are the hot spots. Lower capital costs mean these companies can stretch their runways — and investors notice.
Financials: a mixed bag with upside
Banks and insurers don’t benefit from lower rates in the same way. Cuts squeeze net interest margins, which can hurt profitability. But on the flip side, credit demand rises as borrowing gets cheaper.
What often happens is that well-capitalized banks and alternative lenders pick up steam as loan growth offsets margin pressure. Insurers with strong investment arms can also ride the wave if equities rally broadly.
The trick is being selective. Not all financials win. But the ones positioned for higher lending and trading activity often surprise to the upside.
Industrials and consumer cyclicals
Industrials and consumer discretionary names thrive when cuts lead to stronger confidence. Think airlines, automakers, machinery, and travel firms. When borrowing is cheaper and consumers feel flush, spending returns faster than expected.
This is especially relevant now, since consumers have been under pressure from inflation. A rate cut feels like a release valve, especially on credit card debt and auto loans. Companies in these spaces tend to see a jump in both volumes and investor sentiment.
Energy: the wildcard
Energy is trickier. Rate cuts can spark demand expectations, which helps oil prices. But the sector is more influenced by geopolitics and supply dynamics than the Fed.
Still, energy companies with strong balance sheets and dividend policies can get a bid in a broad market rally. Historically, energy lags at first but catches up as global growth expectations improve.
Why the anomaly matters here
Across all these sectors, the real alpha comes not from buying everything, but from filtering. Do you chase the next hot IPO, or stick with proven winners? Joel Litman would argue for the latter.
His research shows that nearly half of all stocks that double go on to double again — especially when conditions like rate cuts line up. It’s the market’s version of momentum, but backed by accounting signals most people don’t see.
That’s why the Breakout 2025 framework is positioned squarely on these sectors. It’s not about guessing the next Tesla from scratch. It’s about spotting the companies already in motion — and recognizing they might be just getting started.
So if you’re wondering where to look right now, the answer is clear: tech and biotech lead, financials and cyclicals follow, and energy lingers in the background. But the sharper question is: which specific stocks are entering the “Breakout Zone”?
That’s where tools like Joel’s Breakout Screener can take the guesswork out.
The Psychology of Rate-Cut Markets
Numbers tell part of the story, but human behavior tells the rest. When the Fed cuts rates, investors don’t just respond to cheaper money—they respond to what they think the cut means.
Fear and greed in motion
There’s a simple pattern you see over and over: fear first, then greed.
Immediately after a cut, some investors panic, assuming the economy is weakening. Headlines scream “recession alert” or “markets at risk.” The market may even dip for a day or two.
Then reality sets in. Cheaper borrowing costs mean more money in circulation. Companies can refinance debt, fund projects, and investors start chasing returns. Suddenly, what looked like fear transforms into greed. Stocks start rising, sometimes faster than fundamentals would justify.
The trap of overreaction
Human nature also creates opportunity — and danger. Investors often overreact to short-term news, selling winners out of panic or buying laggards out of hope.
That’s why some of the most successful strategies focus on metrics rather than emotion. Joel Litman’s approach, for instance, uses deep accounting analysis to cut through the noise. He doesn’t just look at stock price movement; he examines whether the underlying business is capable of sustaining growth.
By separating signal from noise, investors can avoid the pitfalls of herd behavior — buying at the peak of excitement or selling at the trough of fear.
Herd behavior and momentum
Rate-cut rallies often accelerate momentum stocks. Once a few big names start moving, other investors pile in, worried they’ll miss out. That’s part of why tech and biotech often outperform early in easing cycles: once leaders start moving, momentum drives a cascade of buying.
The catch: momentum can reverse just as fast. Stocks that aren’t grounded in solid fundamentals often tumble when sentiment shifts. That’s why identifying “Breakout Zone” candidates — those with both momentum and strong underlying numbers — is so valuable.
Why contrarian thinking helps
Ironically, some of the best opportunities appear when most investors are cautious. When fear dominates headlines, the smartest investors step back and look for stocks with proven upside potential.
In practical terms, that means asking questions like:
-
Which companies have already doubled and could double again?
-
Are their financials strong enough to sustain growth even if the market dips?
-
How sensitive is the business to borrowing costs?
Answering these questions requires discipline — and that’s exactly what Litman’s framework is designed to do.
The emotional advantage
Investors who understand the psychology of rate cuts often outperform simply by staying patient. They know early dips are often buying opportunities, and early rallies can be signs of momentum, not irrationality.
When you combine this emotional awareness with a quantitative approach, you’re no longer guessing. You’re identifying patterns, understanding the market’s behavioral tendencies, and positioning yourself for outsized gains — all while managing risk.
The practical takeaway
Here’s the bottom line: rate cuts trigger emotions as much as they trigger liquidity. Fear, greed, and herd behavior move prices before fundamentals do. Recognizing this cycle, and knowing how to act without being swept up by it, can make the difference between a stock that doubles and one that falls flat.
And that’s why investors focused on Joel Litman’s Breakout 2025 framework are positioned to benefit. By combining behavioral insights with the Doubles Anomaly, they’re able to spot stocks where momentum and fundamentals align — even amid a chaotic, rate-driven market environment.
Timing Your Moves During a Rate-Cut Cycle
Knowing which sectors or stocks could benefit from a rate cut is one thing. Knowing when to act is another. Timing can be the difference between catching a stock on the upswing or buying too late — or too early.
Early reaction vs. delayed reaction
The initial market response to a rate cut is often volatile. Stocks may spike, dip, or move sideways depending on investor interpretation. That’s why jumping in immediately after a cut can be risky.
Experienced investors watch for confirmation. They look for signals like:
-
Sustained price movement in leading sectors
-
Volume confirming a trend rather than a one-day spike
-
News or earnings that support the market’s optimism
Joel Litman emphasizes the importance of waiting for stocks to enter the Breakout Zone — that sweet spot after an initial surge, when momentum aligns with strong fundamentals. Acting in that zone increases the odds of capturing repeat gains.
Using historical patterns to guide timing
Past cycles offer clues. After most rate cuts near market highs, the S&P 500 has historically risen over the next 6–12 months. But individual stocks often lag or surge ahead of the broader index.
This is where studying patterns pays off. Companies with strong balance sheets, consistent earnings, and prior doubling history often move first. The broader market catches up later.
Dollar-cost averaging vs. concentrated positions
One practical approach is to scale in gradually. Dollar-cost averaging lets you participate without overcommitting if volatility spikes.
Alternatively, for high-conviction opportunities identified through Litman’s Breakout 2025 framework, concentrated positions in select Breakout Zone stocks can produce outsized returns. The key is discipline: know your targets, set stop points, and don’t chase hype.
Watching market cues
Pay attention to:
-
Bond yields: falling yields often indicate the market anticipates easier money
-
Sector rotation: tech, biotech, and discretionary stocks often lead early
-
Earnings guidance: companies adjusting upward signal confidence in growth
These cues help confirm that the rate cut is actually fueling a rally, rather than being a temporary blip.
The risk/reward calculus
Even during favorable cycles, not every investment is a winner. Risk management is essential. Determine how much capital you’re willing to allocate to each trade, and set exit points before entering.
Joel’s approach adds another layer. By filtering stocks through the Doubles Anomaly, you can focus on those with a statistically higher chance of repeating their gains. That doesn’t eliminate risk, but it stacks the odds in your favor.
Practical example
Imagine a tech stock that doubled over the last 12 months. It enters the Breakout Zone as the Fed cuts rates. Momentum, liquidity, and strong fundamentals line up. Historical patterns suggest it could double again — or at least outperform the broader market.
Compare that with a speculative stock with no earnings track record. Even if it looks “cheap,” the risk of downside is far higher. Timing plus quality matters.
Bottom line on timing
Rate-cut cycles reward patience, insight, and precision. Don’t rush in blindly. Use historical trends, sector leadership, and proven frameworks like Litman’s to identify when a stock is truly ready to take off. Acting at the right time in the right stock can dramatically improve your outcomes.
The Role of Tools and Analysis in Capturing Breakout Stocks
Understanding the sectors, the psychology, and timing is critical. But in today’s market, insight alone isn’t enough. Tools and structured analysis are what separate guesswork from calculated opportunity.
Why tools matter
Markets move fast. Rate cuts create immediate ripples, and some stocks react within hours or days. Tracking every relevant signal manually is nearly impossible. That’s where the right analytical tools come in.
Joel Litman’s framework emphasizes a combination of accounting analysis and momentum tracking. By studying a company’s fundamentals — revenue quality, debt structure, earnings reliability — and combining that with market movement, you get a clearer picture of which stocks are truly poised to breakout.
The Breakout Screener
One of the most practical tools for investors today is Litman’s Breakout Screener. It filters stocks based on:
-
Whether they’ve already doubled in price
-
Strong financial health according to proprietary accounting metrics
-
Entry into the “Breakout Zone” for potential repeat gains
This is not about hype or speculation. It’s a systematic way to focus on stocks statistically more likely to continue their upward trajectory, even in a volatile market.
Altimeter Pro: analyzing the fundamentals
Another key piece of the puzzle is Altimeter Pro. This platform dives into the quality of a company’s earnings and balance sheet. Many investors look at top-line growth or stock price alone — but that can be misleading.
Altimeter Pro lets you:
-
Detect accounting irregularities that might signal risk
-
Identify companies with durable, high-quality earnings
-
Compare potential breakout stocks against historical performance metrics
Combining these tools, you can reduce the guesswork and focus on candidates with both momentum and substance.
Why analysis beats emotion
We’ve already talked about the psychology of rate-cut markets. Tools and structured analysis act as a counterbalance to emotion. When fear or greed dominates headlines, having objective data allows you to make decisions based on numbers, not hype.
For instance, a stock might be surging because of sector momentum, but if Altimeter Pro flags weak fundamentals, you might avoid overcommitting. Conversely, a strong stock that hasn’t yet caught the market’s attention could be your next breakout candidate.
Integrating sector trends and timing
Using these tools in isolation isn’t enough. The real power comes from combining them with sector insights and timing strategy:
-
Identify sectors poised to benefit from the Fed’s rate cut
-
Filter for stocks within those sectors showing both historical doubling and strong financials
-
Time entry when momentum, liquidity, and market conditions align
This integrated approach dramatically increases the odds of success.
The advantage of having a system
One of the biggest mistakes investors make during rate-cut cycles is chasing headlines. Tools like the Breakout Screener and Altimeter Pro give you a repeatable, systematic approach. Instead of guessing, you can focus on evidence-backed opportunities.
This is why investors following Joel Litman’s Breakout 2025 framework often outperform. They don’t just look at the next hot stock. They analyze quality, timing, and momentum to identify the names most likely to enter a second doubling phase.
Practical takeaway
The message is simple: in a volatile market triggered by rate cuts, emotion-driven decisions are risky. Structured analysis, quality tools, and a disciplined approach are your edge. When combined with sector trends, timing, and the Doubles Anomaly, they help you spot the stocks most likely to soar.
Real-World Examples of Breakout Stocks in Rate-Cut Cycles
Theory is useful, but real results are what matter. Looking at past cycles, we can see how certain stocks rode rate cuts to outsized gains — and why Joel Litman’s Breakout 2025 framework helps identify similar opportunities today.
Case 1: Tech doubles in the 1990s
During the mid-to-late 1990s, the Fed cut rates multiple times after earlier tightening. Tech companies that had already doubled — names like Microsoft and Cisco — often surged again as the market embraced growth at cheap borrowing costs.
These were not speculative plays; they had strong earnings, solid product pipelines, and expanding market share. Investors who recognized the combination of prior momentum and fundamental strength captured enormous gains.
Case 2: Biotech post-2008
After the 2008 financial crisis, biotech was slow to recover initially. But companies with proven clinical results and clear funding structures eventually entered their “Breakout Zones.” Those that had already achieved major milestones often doubled again once credit conditions eased and investors returned to the sector.
This is a perfect illustration of the Doubles Anomaly: companies that already demonstrated a winning trajectory were far more likely to continue upward than newcomers with unproven records.
Case 3: Tech and growth post-2020 pandemic cuts
The pandemic brought aggressive Fed action. Stocks that had already surged in 2019–early 2020, particularly in cloud computing and AI-adjacent tech, continued to double as the Fed cut rates to near zero.
Companies like Nvidia, Palantir, and Shopify had already proven growth trajectories. Their fundamentals, combined with liquidity from rate cuts, allowed them to climb far faster than the broader market. Meanwhile, less-proven companies often lagged, showing that momentum plus quality mattered.
Patterns emerge
Across all these examples, a few key patterns stand out:
-
Prior doubling matters: Companies that already had significant price growth were more likely to continue surging.
-
Strong fundamentals are essential: Revenue quality, earnings consistency, and balance sheet strength reduced downside risk.
-
Timing with rate cuts accelerates moves: The combination of momentum and easier money often leads to outsized gains.
-
Sector context is critical: Tech, biotech, and capital-intensive growth sectors consistently outperform when liquidity rises.
Applying this today
Today’s expected rate cut fits the historical script. Tech, biotech, and selected industrials are positioned to benefit first. By filtering for companies that have already doubled and are entering their Breakout Zones, investors can dramatically improve the odds of capturing repeat gains.
This is exactly what Joel Litman highlights in Breakout 2025. He’s not just pointing out sectors; he’s identifying individual stocks with the highest probability of repeating their prior gains.
Why this matters for investors now
It’s easy to get lost in headlines or chase every market swing. But history and structured analysis show that focusing on:
-
Companies with prior strong performance
-
Solid financial fundamentals
-
Momentum aligned with liquidity events like rate cuts
…offers a disciplined, high-probability path to gains.
Rate cuts are like setting the wind in a sail. You can’t control the ocean, but you can choose which ships are most likely to catch the breeze and travel far. Litman’s framework helps you identify those ships.
Conclusion
The expected Fed rate cut is more than just a headline event. Historically, these cuts create opportunities across sectors — from tech and biotech to industrials and consumer discretionary. The patterns are clear: liquidity rises, investor confidence adjusts, and stocks with strong fundamentals and prior momentum often outperform.
Yet the lesson isn’t just about sectors. It’s about picking the right companies within those sectors. History shows that not every stock benefits equally. Some fall despite overall market gains, while others repeat their prior success. That’s where a disciplined approach — combining analysis, timing, and tools — makes all the difference.
Joel Litman’s Breakout 2025 framework is designed exactly for this environment. By focusing on the Doubles Anomaly, it highlights companies that have already proven they can surge and are entering the Breakout Zone, positioning investors to capture repeat 100%-plus gains. Rate cuts act as an accelerant, but the real advantage comes from knowing where to look.
Markets are never perfectly predictable, but preparation and strategy tilt the odds in your favor. Understanding sector trends, investor psychology, historical patterns, and disciplined stock selection provides a roadmap for navigating the next move after a rate cut.
The takeaway is simple: the Fed sets the stage, but informed investors choose the actors who are most likely to shine.
FAQ: Stocks Poised to Benefit From a Federal Rate Cut
How do Federal Reserve rate cuts affect the stock market?
Rate cuts lower borrowing costs and make future earnings more valuable in today’s terms. Some sectors — like tech, biotech, and consumer discretionary — often see the most immediate benefit, while others lag. Historically, the S&P 500 has risen in the year following cuts from elevated levels.
Which sectors tend to perform best after a rate cut?
Tech, biotech, industrials, and consumer discretionary generally benefit the most. Tech thrives because growth-oriented companies rely on capital; biotech benefits from cheaper funding; industrials see more business investment; consumer discretionary gains as lower rates support consumer spending. Energy and financials can benefit too, but often in a more nuanced way.
Do all stocks benefit from a rate cut?
No. While the broader market may rise, individual stock performance varies widely. Some companies may underperform due to weak fundamentals, high debt, or sector-specific challenges. That’s why a structured approach, like Joel Litman’s Doubles Anomaly and Breakout Zone analysis, can help identify the highest-probability winners.
What is the “Breakout Zone” and why is it important?
The Breakout Zone is a term Joel Litman uses to describe the moment when a stock that has already doubled enters a sweet spot for rapid further gains. Historical data suggests companies in this zone, particularly during favorable market conditions like a Fed rate cut, have a higher likelihood of repeating 100%-plus gains.
How can I identify which stocks are likely to double again?
Joel Litman’s Breakout 2025 framework combines accounting-based analysis with momentum tracking. Tools like Altimeter Pro and the Breakout Screener filter for companies with strong fundamentals that have already doubled in price, increasing the odds of repeat performance.
Should I buy immediately after a Fed rate cut?
Timing matters. Markets often react emotionally to rate cuts, with initial volatility. Experienced investors watch for confirmation signals: sustained price moves, sector leadership, and alignment with momentum. Entering stocks in the Breakout Zone — rather than chasing headlines — increases the probability of capturing gains.
Can rate cuts cause stocks to fall instead of rise?
Yes. Short-term reactions can be unpredictable. Investors sometimes interpret cuts as signs of economic weakness. But historically, over the medium term (6–12 months), the market tends to benefit, especially when liquidity, fundamentals, and momentum align.
How does investor psychology impact post-rate-cut performance?
Fear, greed, and herd behavior drive short-term volatility. Many investors overreact to news, creating opportunities for disciplined investors. By focusing on data and proven patterns rather than emotion, you can make more strategic decisions.
What makes Joel Litman’s approach different?
Litman combines deep accounting analysis with market momentum tracking. His Doubles Anomaly highlights companies with a proven history of doubling, while his Breakout Zone framework identifies when they’re most likely to repeat gains. It’s a structured, evidence-based approach, not guesswork.
How can I start using the Breakout 2025 framework?
You can reserve access to Joel’s Breakout 2025 event and gain tools like the Altimeter Pro and Breakout Screener. These resources help investors filter stocks, track momentum, and identify high-probability opportunities in the current market, particularly after rate cuts.