In the world of investing, breakthroughs that promise to revolutionize how we approach the markets are often met with skepticism. Yet, TradeSmith, a financial technology company with 20 years of innovation behind it, has unveiled what it calls its biggest advancement yet: the Seasonality Investor, powered by the “Green Day” system. This system claims to predict the biggest jumps in over 5,000 stocks down to the day, with an 83% backtested accuracy rate across 33 years of market history. It focuses on seasonality—hidden cycles in stock prices that repeat year after year, allowing investors to potentially double their portfolios by targeting short-term opportunities rather than long-term holdings.
Led by CEO Keith Kaplan, TradeSmith has built a reputation for helping 72,000 users track $30 billion in assets through algorithms featured in outlets like CNN, CNBC, Forbes, and The Wall Street Journal. The “Green Day” system builds on this foundation, using a secret pioneered by successful hedge funds and uncovered through 50,000 daily tests on historical data. Early testers report impressive results, such as doubling money in three weeks or tripling positions, though disclaimers emphasize that these are not typical and investing carries risks.
This review dives deep into the Seasonality Investor, exploring how the “Green Day” system works, its backtested performance, real-world examples, and why TradeSmith believes it’s essential in today’s disconnected market. We’ll also examine its legitimacy. If you’re frustrated with traditional buy-and-hold strategies amid volatility, this could represent a new way to manage cash using an online calendar of predictable stock moves.
The Historical Context and Discovery of Seasonality
TradeSmith’s journey to the “Green Day” system began with a mission to challenge conventional investing wisdom. For decades, investors have focused on earnings announcements, product developments, valuations, debt, and macroeconomic factors to decide when to buy stocks.
However, Kaplan argues that all the money one could want in the market boils down to a handful of calendar dates, ignoring those usual triggers. This stance stems from a 33-year study analyzing billions of data points, revealing that stocks exhibit repetitive patterns driven by human emotions like fear and greed, creating predictable cycles.
The discovery traces back to historical market mysteries, such as the “January Effect,” where stocks rise higher in January than any other month due to tax-related selling and buying. Similar cycles have predicted major events, from the Panic of 1893 to the 2008 crash. Samuel Benner, a 19th-century farmer who lost everything in the 1873 panic, manually analyzed price data for commodities like iron and corn, uncovering cycles that accurately forecasted market panics years in advance. His work laid the foundation for understanding that history repeats with remarkable accuracy, influenced by unchanging human emotions.
TradeSmith modernized this concept with quantitative analysis, spending over $20 million on more than 100 algorithms. Frustrated with long-term investing’s vulnerabilities—evident in the flat returns from 2020 to 2022 amid COVID volatility—they sought short-term edges.
Assigning a team of 74 researchers with an $8 million annual budget, they ran 2.24 quintillion data tests on 5,000 stocks since 1991, requiring at least 300 positive results for statistical significance. The result: identification of “green days,” specific dates when stocks enter “green zones” of upward movement, with high historical success rates.
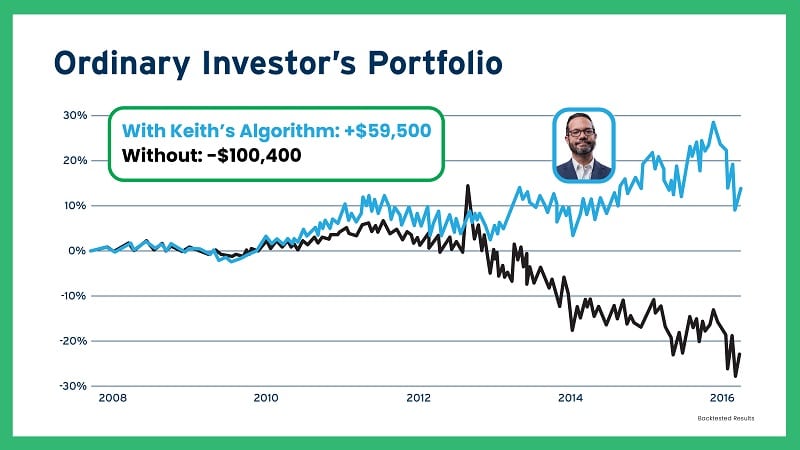
This breakthrough transcends previous TradeSmith tools, like the Volatility Quotient (VQ) algorithm that optimizes buy/sell timing and position sizing, turning losses into gains for users. One retiree reportedly transformed a $100,000 loss into a $59,000 gain using VQ.
The “Green Day” system elevates this by pinpointing dates for potential multi-fold returns, even in bear markets, making it Kaplan’s “life’s work.”
Understanding the “Green Day” Phenomenon
At its core, the “Green Day” system identifies seasonality—cyclical patterns in stock prices that occur on specific calendar dates, year after year, with an overall 83% backtested accuracy. These patterns are hidden and can’t be spotted manually; they require advanced algorithms processing gigabytes of data from sources like the Dow, S&P 500, and Nasdaq. The system ignores traditional factors like earnings beats, FDA approvals, or legislation, focusing instead on when emotions drive prices higher.
A “green day” opens a “green zone,” a short window (often 15-90 days) where the stock historically rises. For instance, Carnival’s green day is October 19, rising an average 9.8% over 20 days with 100% historical success over 15 years—equivalent to 453% annualized if repeated. Advanced Micro Devices (AMD) has November 16, up with 86% success; Lululemon March 14 at 87%; Broadcom May 23 at 100%; and Lithia Motors June 19 at 93%. These zones allow ignoring 345 days of the year while capturing market-average returns in a fraction of the time.
The phenomenon isn’t limited to exciting stocks like Nvidia, which has October 24 as its green day, rising 7.8% over 15 days with 100% success, even pre-AI hype. Allient, a gear shift manufacturer, has October 28, up 20% over two months at 100% success—125% annualized equivalent. Toro October 24 at 100%; Emerson Electric October 31 at 93%. Even “garbage” companies like Ligand Pharmaceuticals (delisted for irregularities) have February 18, up 7% monthly at 86%.
TradeSmith’s model portfolio, trading top S&P 500 green zones, turned $10,000 into $85,700 over 18 years, crushing the S&P by 99%. This success holds through bull and bear markets because seasonality exists in a vacuum, unaffected by external events. Emotions create cycles like the 7-year pattern (crashes in 2001, 2008, 2015, 2022) or longer ones predicting 1929’s crash.
How the System Works: Algorithms and Data
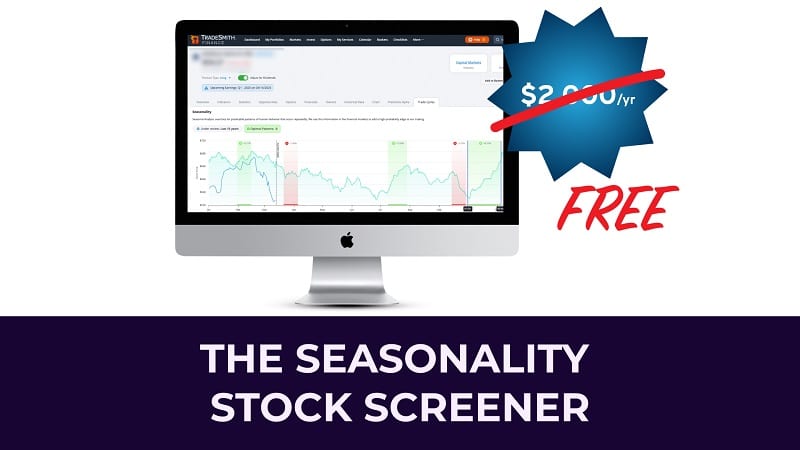
TradeSmith’s Seasonality Stock Screener is the tool powering the system, continually updating with new data from 5,000 stocks. It runs 50,000 tests daily, recalibrating every nine months for evolving patterns. The key variable is seasonality, isolated after experimenting with metrics like momentum, RSI, and moving averages. By letting the algorithm decide without human bias, it pinpointed dates for buy and sell signals.
The process worked backward from human emotion: prices rise when people pay more, driven by fear, greed, etc., creating measurable cycles. Rational data (stock prices) reveals patterns over time, unlike irrational numbers like pi. For Parker-Hannifin, analysis showed October 19 to December 3 up 10% at 100% success. Netflix May 8 up 18% over 65 days at 100%; Monster Beverage April 14 up 3.9% over 20 days at 87%.
The system also identifies “red days” for bearish seasonality, when stocks fall. Wynn Resorts May 2 down 10% over 55 days at 93%; Disney September 13 down 2.5% over 15 days at 86%; NeuroMetrix April 23 down 17% over 25 days at 100%. This dual capability avoids losses, enhancing risk management.
To “boost” gains, the system recommends call options during green zones, amplifying returns 5-10 times. Options make money when stocks rise, with limited downside (only the premium risked). Examples: Eaton Corp. 548% in 32 days (2016); BOK Financial 11,340% in 46 days; Coherent Corp. 1,400% in 4 days. This isn’t gambling; it’s leveraging high-probability zones.
Real-World Examples and Backtest Results
The presentation provides numerous examples demonstrating the system’s efficacy. Nvidia’s green zone predicted gains even before AI dominance, boosting to 455% in 10 days. Allient’s 20% two-month rise equated to 125% annualized, boosted to 756% in 18 days (2024). Toro 9% in 65 days boosted to 748% in 49 days (2023); Emerson Electric 5% in 31 days to 692% in 16 days (2016).
MicroVision May 15 up 19% in 15 days at 87%; Aehr Test Systems July 1 up 16% in 15 days at 93%. Eversource Energy October 2 up at 93% success. Stryker 4% in 28 days boosted to 243%; Williams-Sonoma 7% in 14 days to 217%. Amazon May 24 up 10.2% over 50 days at 100%, even in 2020 crash.
In bear markets, the system shines. 2022’s model portfolio rose while S&P fell, with gains like Entegris 617% in 43 days (options). 2008’s Royal Caribbean up in green zone; 2009’s Netflix up despite recession. Options in crashes: 831% in 51 days (2011 sideways market); 242% in 48 hours (2009 bear).
Testimonials highlight user success: one doubled in three weeks; another tripled one position, doubled two others; 8x money with boost. A user gained $40K in 30 days; another from $85K to $203K; reached millionaire status. Disclaimers note atypically and risks.
Boosting Gains: The Options Strategy
The “boost” feature uses call options to amplify green zone gains, turning modest rises into explosive returns. Options aren’t required—users can buy stocks for 10% average gains—but offer 100-500%+ potential. Risk is limited to the premium, unlike leveraged gambling.
Examples: Nucor 561% in 28 days; Chubb 674% in 44 days; Heico 398% in 12 days; Yum Brands 708% in 31 days; Pepsi 298% in 30 days; Ametek 407% in 8 days; Take-Two 303% in 5 days; Old Dominion 759% in 42 days. Even in volatility: Coterra 57% in 48 hours; Applied Materials 47% in 13 days; Adobe 65% in 10 days.
The Master Class bonus teaches setup, structuring trades, and brokerage tweaks. It emphasizes low-risk, high-probability plays based on 83% accuracy zones, not speculation.
Red Zones: Avoiding Losses
Red zones identify bearish seasonality for sells or avoids. Globalstar September 18 down 8% at 87%; Urban Outfitters September 13 down 4% at 93%. In 2024, ProShares Bitcoin ETF red zone down 27% over three months at 100% history.
This protects capital, especially in volatility. During 2020 rally, Wynn Resorts red zone signaled drop; 2022’s Intel green zone allowed gains amid broader falls. The bonus “Top 3 Stocks to Avoid Right Now” lists current red zone risks.
Why Seasonality Investor is Essential Today
Today’s market shows historic disconnects: S&P at 6,000 while tech funds see $5 billion outflows; tech falling while small caps rise. Kaplan predicts that earnings season start will accelerate volatility with surprises, making long-term holding risky. Stocks like Intel (-worst drop since 1974), Microsoft (fell despite beats), Nvidia (flat after revenue double).
Buy-and-hold could yield flat returns, as in 2020-2022. Inflation erodes cash (20% cumulative since 2020), making CDs/T-bills insufficient (real yield ~1% after 3% inflation). Seasonality offers short-term trades without long exposure, potentially doubling portfolios in bull/bear markets.
The system levels the field against hedge funds like Renaissance (2,103,217% returns) using similar quant edges. TradeSmith democratizes this for retail investors.
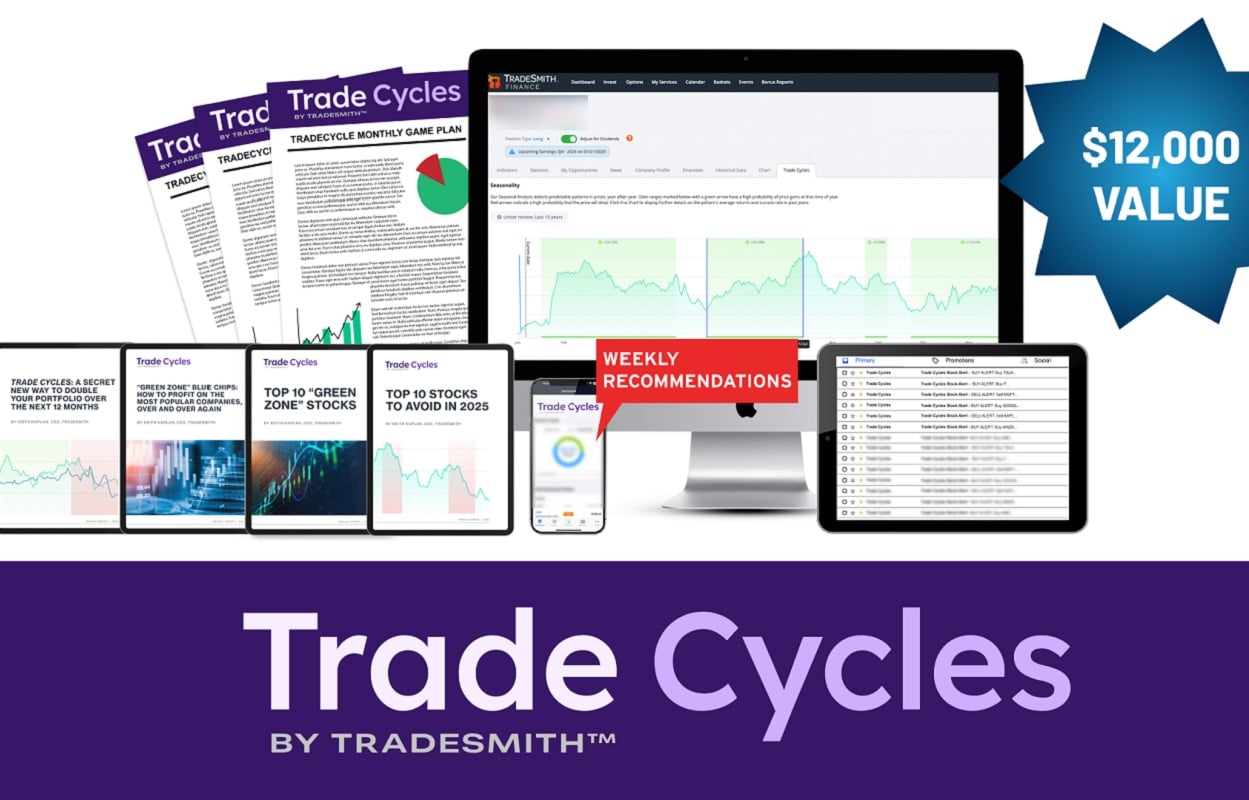
The Seasonality Investor Service: Features and Benefits
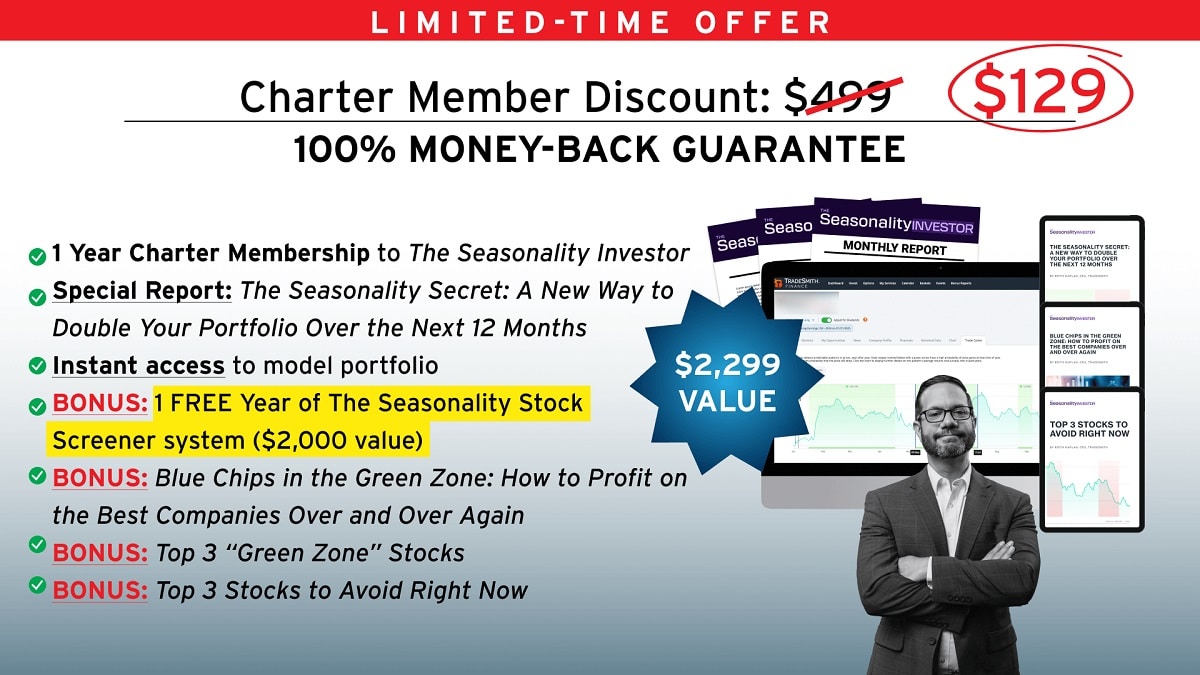
Seasonality Investor provides two monthly recommendations from 500-1,000 annual opportunities, focusing on high-quality businesses. Each includes stock and optional options play, with buy/sell alerts. Model portfolio crushed S&P by 99%, turning $10K to $85.7K over 18 years.
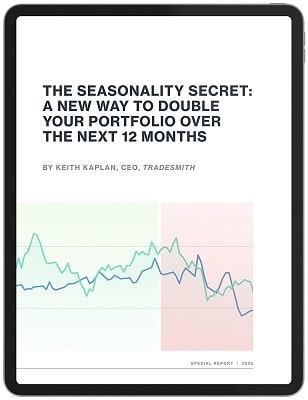
Bonuses: “The Seasonality Secret” report; Master Class; “Blue Chips in the Green Zone” (3 blue chips with multiple zones); “Top 3 ‘Green Zone’ Stocks” (from InvestorPlace); “Roadmap 2025” (sector outlooks); “Top 3 Stocks to Avoid”; one-year Seasonality Stock Screener ($2,000 value, 10 searches/month).
Pricing: $129/year (74% off $499), 60-day money-back guarantee. Charter mystery gift ($1,999 value) for immediate orders.
Legitimacy of TradeSmith’s “Green Day” System
TradeSmith’s credibility stems from 20 years, $30B tracked, media features, and user success (e.g., $5.3M from $250K; $1M portfolio growth). Testimonials praise risk reduction, profitability, though atypical with risks noted. Legends like Louis Navellier and Marc Chaikin endorse the innovation.
Backtests across 33 years, including crises, yield 83% accuracy. Origins in Benner’s cycles add historical legitimacy. As a TradeSmith system, it builds on proven tools like VQ, turning losses to gains.
Free recommendations: Buy Ralph Lauren (RL, green zone, 87% success); Avoid General Electric (GE, red zone).
Conclusion: Embrace the Seasonality Revolution
TradeSmith’s Seasonality Investor and “Green Day” system offer a paradigm shift, predicting stock jumps with 83% accuracy via seasonality cycles. By targeting green zones, investors can potentially double portfolios short-term, boost with options, and avoid red zones, all without traditional analysis. In volatile times this mitigates long-term risks while capturing upside.
With bonuses, guarantees, and proven backtests, it’s a legit TradeSmith innovation. Don’t miss charter access—order now to transform your investing.
TradeSmith’s Seasonality Investor and the “Green Day” System
What is TradeSmith’s Seasonality Investor?
The Seasonality Investor is a new research service by TradeSmith that uses the “Green Day” system to identify specific dates when stocks are likely to rise, known as “green zones,” with an 83% backtested accuracy rate. It provides two monthly stock recommendations, including optional call options plays, to help investors potentially double their portfolios over 12 months by trading these high-probability periods.
What is the “Green Day” system?
The “Green Day” system is an algorithmic tool that pinpoints “green days”—specific calendar dates when individual stocks historically enter a “green zone” of upward price movement. By analyzing 33 years of data across 5,000 stocks, it identifies these cycles with an 83% backtested success rate, allowing investors to buy and sell at optimal times, regardless of market conditions.
How does the “Green Day” system work?
The system uses a proprietary algorithm, running 50,000 daily tests on 5,000 stocks, to uncover seasonality—repetitive price patterns driven by human emotions like fear and greed. It ignores traditional factors (earnings, news, valuations) and focuses on historical data since 1991, recalibrating every nine months to adapt to evolving patterns. It also identifies “red zones” for bearish periods to avoid losses.
What are “green zones” and “red zones”?
Green zones are short-term periods (15-90 days) starting on a stock’s “green day,” where it historically rises with high probability (e.g., Carnival October 19, up 9.8% in 20 days at 100% success). Red zones are bearish periods where stocks tend to fall (e.g., Wynn Resorts May 2, down 10% in 55 days at 93%). Both are backed by 33 years of data with at least 83% accuracy.
How accurate is the “Green Day” system?
The system has an 83% backtested accuracy rate across 33 years (since 1991), requiring at least 300 positive trade results for statistical significance. It works in bull and bear markets, as demonstrated in 2022 when the model portfolio rose while the S&P 500 fell.
What is the “boost” feature, and how does it work?
The “boost” feature uses call options during green zones to amplify gains by 100-500% or more. For example, BOK Financial’s 9.8% stock gain became an 11,340% options gain in 46 days. Risk is limited to the premium paid, and the Master Class bonus teaches low-risk options strategies based on high-probability zones.
Is options trading with Seasonality Investor risky?
Options carry risk, as you can lose the premium paid, but TradeSmith minimizes this by recommending options only in high-probability green zones (83% accuracy). Investors can opt for stock-only trades to avoid options entirely, still targeting significant gains (e.g., 10% in 44 days on Eaton Corp.).
How does the system perform in bear markets?
The system excels in bear markets because seasonality is unaffected by external events like recessions or crashes. In 2022, while the S&P 500 tanked, the model portfolio delivered gains like 617% on Entegris (options). In 2008, Royal Caribbean rose in its green zone despite the recession, showing reliability across market conditions.
What makes Seasonality Investor different from traditional investing?
Unlike traditional buy-and-hold, which relies on earnings, valuations, or news, Seasonality Investor focuses on short-term, high-probability price cycles. It avoids long-term risk exposure, offering rapid-fire trades (e.g., 11% in 85 days on Pepsi) that can outperform even in flat or down markets.
What is included with a Seasonality Investor subscription?
- Two monthly recommendations: High-quality stocks with upcoming green zones, plus optional options plays.
- Seasonality Stock Screener: Free one-year access ($2,000 value) for 10 monthly searches across 5,000 stocks.
- Reports: “The Seasonality Secret,” “Blue Chips in the Green Zone,” “Top 3 ‘Green Zone’ Stocks,” “Roadmap 2025,” “Top 3 Stocks to Avoid.”
- Master Class: Video tutorial on spotting green/red zones and options trading.
- Mystery Gift: $1,999 value for immediate subscribers.
- 60-day Money-Back Guarantee: Full refund if unsatisfied.
How much does Seasonality Investor cost?
The charter offer is $129/year, a 74% discount from the regular $499. It’s risk-free with a 60-day full refund policy.
Is TradeSmith’s Seasonality Investor legitimate?
Yes, TradeSmith’s 20-year history, $30B in tracked assets, and media features (CNN, CNBC, Forbes) support its credibility. Endorsements from Wall Street legends like Louis Navellier and Marc Chaikin, plus user success (e.g., $5.3M from $250K), affirm its legitimacy. The 33-year backtest with 83% accuracy adds rigor.
What are the free recommendations provided?
- Buy: Ralph Lauren (RL), with an upcoming green zone (87% success rate).
- Avoid: General Electric (GE), due to a red zone signaling likely declines.
Does the system work for blue-chip stocks or volatile assets like bitcoin ETFs?
Yes, blue chips like Pepsi and UPS have multiple green zones (e.g., Pepsi 11% in 85 days). For volatile assets, ProShares Bitcoin ETF showed a 22% gain in 20 days in 2024, boosted to 186% with options, offering high upside with managed risk.
Can I try Seasonality Investor risk-free?
Yes, the 60-day money-back guarantee allows you to review the service, reports, and screener. Contact TradeSmith’s Customer Service for a full refund if unsatisfied.
How do I get started with Seasonality Investor?
Click here to secure the $129 charter offer, including all bonuses. Act before the offer expires to lock in access and the mystery gift. Start with the free recommendations (buy RL, avoid GE) and explore the screener for your own picks.