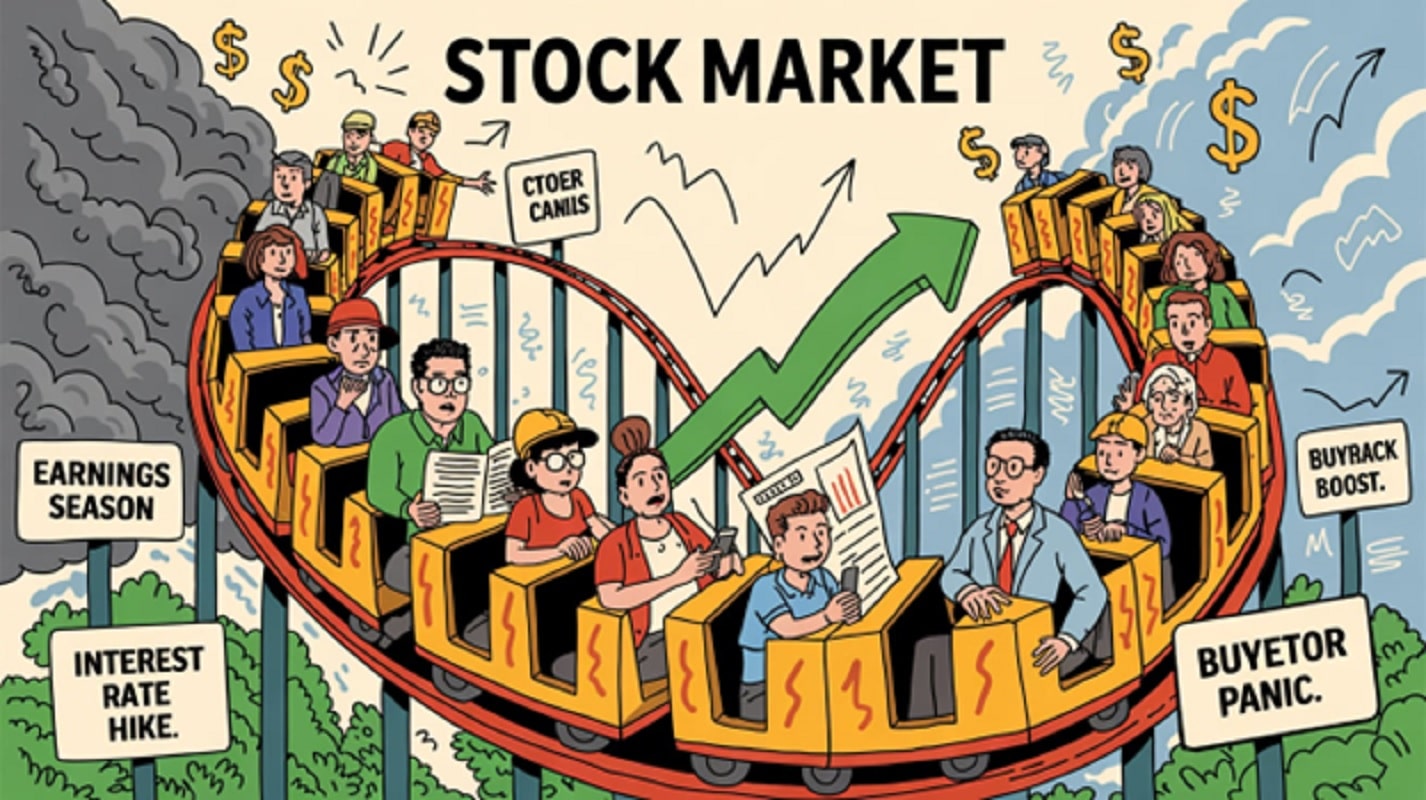
Stock prices swing like a pendulum at a theme park—one minute they’re soaring, the next they’re nosediving. Whether you’re a Wall Street pro or just dipping your toes in, getting why stocks zigzag can save you from panic-selling your portfolio during a tweetstorm.
In this guide, we’ll crack open the hood on what really moves markets: earnings reports, the tug-of-war between buyers and sellers, big-picture stuff like interest rates, and even the mood swings of investors.
Corporate Fundamentals
At its core, a stock represents ownership in a company. Over time, a firm’s financial performance—its ability to generate revenues, profits, and cash flows—should determine its intrinsic value. However, markets often anticipate changes in fundamentals well before quarterly reports arrive.
- Earnings and Revenue Growth
Positive earnings surprises (profits above analysts’ expectations) typically spark upward price revisions, while negative surprises can trigger sharp sell‑offs. Investors watch guidance for future quarters closely, since optimistic projections can propel shares even if current results are merely “in line.” - Profitability Metrics
Ratios such as return on equity (ROE), profit margins, and free cash flow yield signal corporate efficiency. Improving margins or rising free cash flow can attract buyers, whereas margin compression—perhaps from rising input costs—can weigh on valuations. - Balance Sheet Health
A strong balance sheet (low debt relative to equity, ample liquidity) gives a company resilience during downturns, often commanding a premium multiple. Conversely, high leverage can stoke fears of distress, especially if interest rates rise.
Key takeaway: Sustainable long‑term price appreciation depends on solid fundamentals. But markets will often “look around the corner” to anticipate future performance.
Supply and Demand Mechanics
Equity prices move through the interplay of buy and sell orders in the market’s order book. Understanding these microstructure dynamics helps explain short‑term fluctuations.
- Order Flow and Liquidity
High liquidity (many buyers and sellers) generally means tighter bid‑ask spreads and smoother price moves. Thinly traded stocks can gap abruptly on relatively small orders, creating spikes or plunges. - Institutional Activity
Large institutional investors—mutual funds, pension plans, hedge funds—trade blocks of shares that can sway prices. Institutions also engage in program trading and portfolio rebalancing at quarter‑ends, leading to predictable flows. - Corporate Actions
Events such as share buybacks reduce the supply of outstanding shares, often boosting the price. Rights offerings or secondary issuances increase supply and can dilute existing shareholders, applying downward pressure.

Macroeconomic Forces
Stocks do not trade in a vacuum; they are sensitive to the broader economic environment.
- Interest Rates
When central banks cut rates, borrowing costs fall, which can fuel consumer spending and corporate investment—positive for stocks. Lower discount rates also increase the present value of future cash flows, lifting valuations. Conversely, rising rates can depress multiples and cool economic activity. - Inflation Trends
Moderate inflation often accompanies growth, but runaway inflation erodes purchasing power and corporate margins. Unexpected spikes in inflation can spook investors, triggering broad sell‑offs. - Economic Growth
GDP growth, employment data, and consumer confidence surveys shape expectations for corporate revenues. Sluggish growth or recessions can slash profit forecasts, hurting equities, while surprise expansions can ignite rallies. - Currency Movements
A strong domestic currency makes exports less competitive and can weigh on companies with significant overseas sales. Conversely, a weaker currency boosts dollar‑based sales for exporters.
Market Sentiment and Behavioral Biases
Investor psychology often drives prices beyond what fundamentals justify, creating both opportunities and risks.
- Fear and Greed Cycles
Metrics like the CBOE Volatility Index (VIX) gauge fear in the market. Spikes in the VIX often coincide with rapid sell‑offs, while extremes in bullish sentiment surveys can signal contrarian buy opportunities. - Herding Behavior
Investors tend to follow crowd behavior—buying when others buy and selling when others sell. This can fuel bubbles on the upswing and exacerbate crashes on the downswing. - Anchoring and Loss Aversion
Many traders fixate on purchase prices and resist selling at a loss, even when fundamentals deteriorate. Conversely, they can take profits too quickly when a position turns profitable, fearing a reversal.
Technical and Quantitative Factors
Beyond fundamentals and sentiment, many traders rely on price‑based signals and algorithmic strategies that can amplify moves.
- Trend‑Following Models
Moving‑average crossovers and momentum indicators (e.g., RSI, MACD) trigger systematic buys or sells when key thresholds are crossed. When enough participants use similar rules, these models can reinforce trends. - Volatility Targeting
Some hedge funds and risk‑parity strategies adjust exposure based on realized or implied volatility. A sudden increase in volatility can force these funds to sell equities to maintain risk budgets, pushing prices lower in a feedback loop. - High‑Frequency Trading (HFT)
HFT firms exploit tiny price discrepancies and provide liquidity, but they can also exacerbate volatility during market stress as algorithms rapidly unwind positions.
External Shocks and News Events
Markets hate surprises. Wars, sanctions, pandemics, or surprise regulations can torch sectors like energy or tech in a flash. Investors either dive into bunkers (gold, bonds) or YOLO into meme stocks/crypto, betting on chaos. Your best move? Stay nimble—crises hit like a sneaker wave. No one rings a bell.
Global and Sector Rotation
Capital flows move not just between individual stocks but across sectors and regions as participants chase performance or seek safety.
- Sector Rotation
During early economic recoveries, cyclical sectors (e.g., industrials, financials) often lead, while late‑cycle phases see defensive sectors (e.g., utilities, consumer staples) outperform. Recognizing rotation patterns can help explain shifting leadership and price action. - Cross‑Border Flows
Emerging‑market equities can rally when global risk appetite is high and commodity prices are strong; they may underperform when investors seek safe havens in U.S. Treasuries or the dollar.
Corporate Actions and Structural Changes
Beyond operational results, corporate decisions can directly impact share prices.
- Mergers & Acquisitions
Announcements of buyout deals typically lift a target’s price toward the offer level, while the acquirer’s stock may fall if investors question valuation or deal financing. - Dividends and Share Repurchases
A new or increased dividend can signal management’s confidence in cash flows, often leading to a price bump. Buyback programs reduce supply and can support prices over time. - Stock Splits and Spin‑Offs
Splits make shares more accessible to retail investors and can generate buying enthusiasm, though they do not change a company’s fundamental value. Spin‑offs create separate entities that can unlock value if the market had undervalued the combined business.

Putting It All Together
No single factor fully explains every price movement; rather, stock prices are the net result of anticipation, reaction, and feedback loops among these drivers:
- Anticipation: Markets price in expected changes before they occur (e.g., rate cuts priced in months ahead).
- Reaction: Unexpected news or data can trigger abrupt repricing (earnings misses, geopolitical flare‑ups).
- Feedback: Price moves can alter sentiment and trigger mechanical trading rules, further reinforcing trends.
For investors, the key is not to predict every twist and turn perfectly, but to understand which forces are most relevant at any given time and position portfolios accordingly. A balanced approach might combine:
- Fundamental Anchoring
Invest in companies with strong financials and durable competitive advantages. - Technical Awareness
Use key support/resistance levels and trend indicators to guide timing and risk management. - Sentiment Gauges
Monitor contrarian metrics to spot extremes of fear or greed. - Macro Context
Stay attuned to policy shifts, economic releases, and global events that could upend market assumptions.
Conclusion
Stock prices rise and fall as an ever‑evolving dialogue among fundamentals, supply and demand dynamics, macroeconomic currents, sentiment swings, technical patterns, and exogenous shocks. By dissecting these drivers and recognizing how they interact, investors can move beyond mere reaction and cultivate a structured framework for interpreting price movements. Ultimately, mastering the “why” behind stock volatility is a journey that demands continuous learning, discipline, and adaptability—but it is also the cornerstone of informed, resilient investing.
FAQs: Why Stock Prices Rise and Fall
If a company’s profits are growing, why does its stock sometimes crash?
The market’s a drama queen—it cares more about expectations than actual results. If investors already priced in 20% profit growth and the company only delivers 15%, the stock might tank, even if profits technically rose. It’s like getting a B+ when everyone expected an A.
Why do stocks swing wildly even on ‘no news’ days?
Blame algorithms, bored day traders, or that one hedge fund manager who had too much coffee. High-frequency trading bots react to tiny price moves in milliseconds, and herd mentality kicks in. Plus, big players rebalance portfolios silently (no headlines needed).
How do interest rates actually affect my portfolio?
Think of rates as gravity:
- Low rates = Cheap borrowing fuels spending, investing, and stock bubbles.
- High rates = Loans get pricey, growth slows, and investors ditch risky stocks for safer bonds.
Should I panic-sell when the market crashes?
Only if you enjoy buying high and selling low. Crashes are normal—like a forest fire that clears deadwood. If you’re holding solid companies, you may do nothing.
What’s the deal with ‘technical analysis’? Isn’t it just astrology?
Kinda, but with math. Charts show where crowds might panic or get greedy. Example: If everyone’s watching the 200-day moving average and the stock bounces off it, it becomes a self-fulfilling prophecy. Use it as a tool, not a religion.
Why do stocks sometimes drop after GREAT earnings?
Three words: Buy the rumor, sell the news. If everyone already piled into the stock ahead of earnings, they’ll cash out once the report drops—even if it’s good. It’s like leaving a party right as the cake arrives to beat traffic.
How do I protect my portfolio from geopolitical messes (wars, trade wars)?
You can’t. But you can:
- Diversify: Own stocks, bonds, gold, and maybe crypto (if you’re edgy).
- Avoid single-country ETFs: Don’t put all your eggs in a geopolitical basket.
- Ignore TV pundits: They get paid to freak you out.