Understand the concept of relative volume in stocks, understand its impact on trading, and how to use it to distribute market conditions and price trends.
Relative volume is one of the most significant indicators, which have been neglected, when analyzing the stock market. But what is relative volume in stocks and why is it important? Relative volume (RVOL) is used to determine the degree of activity of a given stock on the day of the day compared to its average volume of trading at a certain point of time. It assists traders to know whether there are an excess or fewer buyers and sellers of a particular stock as compared to normal and therefore provides early indications of a possible price action or negative turns.
Understanding What Relative Volume Means
Relative volume is simply defined as a ratio that presents a comparison between the current volume with the past volume of a stock. As an example, in case a stock trades 1 million shares a day, and it suddenly trades 5 million shares, the RVOL of that stock is 5. This implies that it is trading five times its usual rate giving a clear indication of high relative volume. The spikes are usually a sign of heightened interest by traders, future news or extensive institutional trading.
When one poses a question that goes like, what is relative volume in stocks and how do I utilize it? The answer to this question is based on the fact that this measure indicates the deviation of trading activity in relation to what is considered normal. It shows whether the amount of shares traded on this day is lower or higher than the average ones, which will allow traders to predict the price movement more precisely.
How Relative Volume Is Calculated
The computation of RVOL is easy.
The formula is:
Relative Volume = Current Volume ÷ Average Volume (over a specific period of time)
For Example, a relative volume of 3 would therefore mean that the current volume of stock is 3 million shares and the historical volume of stock is 1 million shares. This implies that the trading is three times greater than normal.
In interpreting the relative volume in stocks, it is worth keeping in mind that RVOL above 1 shows high activity whereas below 1 shows low trading. Nevertheless, when interpreting such signals, traders should always have market conditions and other external information such as news, earnings, or market sentiment.
Why Relative Volume Matters for Traders
Knowledge of what is relative volume in stocks can assist the traders to discover decisive opportunities. Here’s why it’s important:
- Identifies Abnormal Trends in the market: When the volume becomes more than usual this indicates that something is at stake.
- Confirms Price Movement: Volume Confirms the power of the price action. A break out in high relative volume is safer.
- Improves Momentum Trading: Momentum traders use spikes in RVOL to trade day in day out.
- Indicates Strength of Buyers and Sellers: When the number of shares traded is above the average, it becomes clear that there is strength in the buyers and sellers.
Relative volume, therefore, functions as a magnifying glass to trader behavior when gauging the performance of a stock.
Factors That Affect Relative Volume
Relative volume needs to be used properly in order to comprehend what affects it. Some key factors include:
- Market Situation – Volatility and significant market occurrence may elevate activity.
- Company News or Earnings – Announcements will bring more traders into the market raising the current volume average.
- Measured Period of Time – Daily RVOL may vary either with weekly or monthly averages.
- Sector Movements- Industry – Wide crashes or rallies have the ability to elevate the trading volume among similar stocks.
The traders can use the observation of these factors to know whether the high RVOL is the true interest or it is merely a noise.
Relative Volume and Price Movement
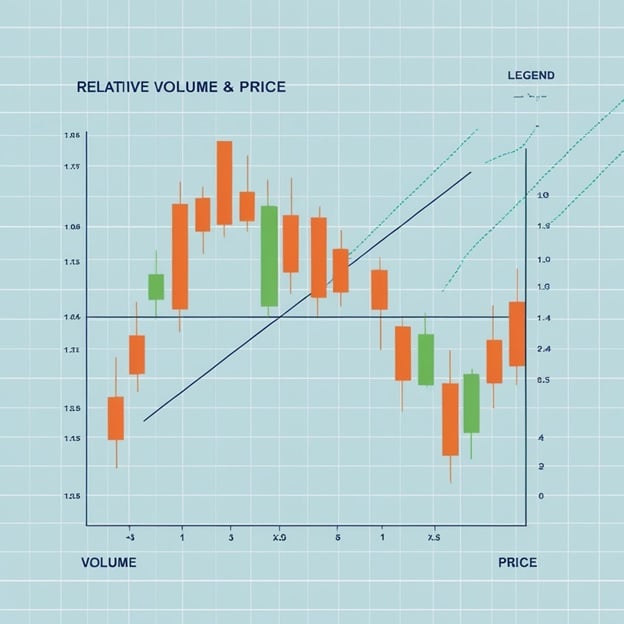
Relative volume and price movement are closely related. Once a stock surges through its support or resistance level and high volume is registered, it is an attestation of a true breakout. Such moves can easily be deceitful and brief without sufficient volume.
In other words, in strong momentum trading, a stock will have RVOL 3-10 where traders enter and exit the stock very quickly. This is a sign of a high degree of activity that usually contributes to the greater intraday price action movements. As such, it can be well-known that learning about what is relative volume in stocks can give you an idea about whether the price action that you are witnessing is long-term.
Relative Volume in Volume Trading Strategy
The following is the application of RVOL in a volume trading strategy by traders:
- Filter on Stocks with High RVOL: Only concentrate on stocks which are trading at least twice their average trading volume.
- Compare Volume Over Time: Compare volume with history.
- Check Key Levels: Find out the levels of support or resistance to predict breakouts.
- Test Market Conditions: Be sure that that high RVOL is not as a result of one-time events.
- Combination: Combine Indicators: Combine Pair of RVOL with moving averages or momentum trading signals to prove setups.
With relative volume as part of the daily analysis, you can obtain a better idea of the sentiment of real time traders and the possible price movements.
Practical Examples of Relative Volume
Now we shall consider some actual cases:
Example 1: A technological stock typically trades 500, 000 shares per day but it is unexpectedly trading 3 million shares – an RVOL of 6. This may be a sign of huge investor interest ahead of earnings.
EXAMPLE 2: A small-cap company whose million shares are being traded on quiet trading days suddenly surges to 5 million, which indicates that there is speculation.
Example 3: The high volume of some stocks in the market opening period is a short-lived occurrence as participants at the start of the day respond to news over the night.
All these illustrations demonstrate that relative volume in stocks is not merely a theory, but a breathing life of the stock market excitement and involvement.
Limitations in the Relative Volume
RVOL is not an independent signal despite being a powerful signal.
- It does not imply direction, high RVOL might take place both in rallies and sell-offs.
- Readings may not be true and correct on low-volume trading days.
- It works well with such technical indicators as RSI, MACD, or moving averages.
Another thing that traders should ensure is that the current volume average applied in calculation corresponds to the time scale of their strategy.
Relative Volume vs. Average Trading Volume
- An average trading volume and a relative volume are the most standard misunderstanding.
- Average trading volume informs you of the number of shares which are actively traded on average.
- Relative volume is used to determine how the ongoing activity is in relation to the normal conditions.
That is, average volume is a fixed value whereas relative volume is dynamic, that is, it indicates whether the current interest is higher or lower than usual. This is why knowing what the relative volume is in stocks will help you to interpret the volume more effectively than the behavior in the past.
Expert Tips for Trading with Relative Volume
- RVOL should always be analyzed within the price action.
- Use more time intervals to eliminate spurious peaks.
- Track the market conditions and then do it.
- A combination of RVOL and support/resistance level analysis.
- Record trading days trends to determine the days when the high RVOL generally occurs.
This knowledge can enhance your association trading and put you in a position to identify arrangements that are consistent with your volume trading plan.
Conclusion
In conclusion, it is important to know what is relative volume in stocks in case a trader wants to master volume-based analysis. Relative volume gives an overview of the current trading status of a stock in relation to the past trading history to give hints about the involvement and direction of traders.
It is a very strong forecasting tool of breakouts, strength of a trend and possible reversals when combined with average trading volume, price action, and key market conditions. With an efficient use of RVOL, traders are able to make superior trading choices, recognize genuine momentum trading opportunities and respond with confidence when a stock breaks significant levels.
After all, relative volume is not merely a figure, but it is an indicator of the enthusiasm of the crowd, how buyers and sellers influence every single step of the market.