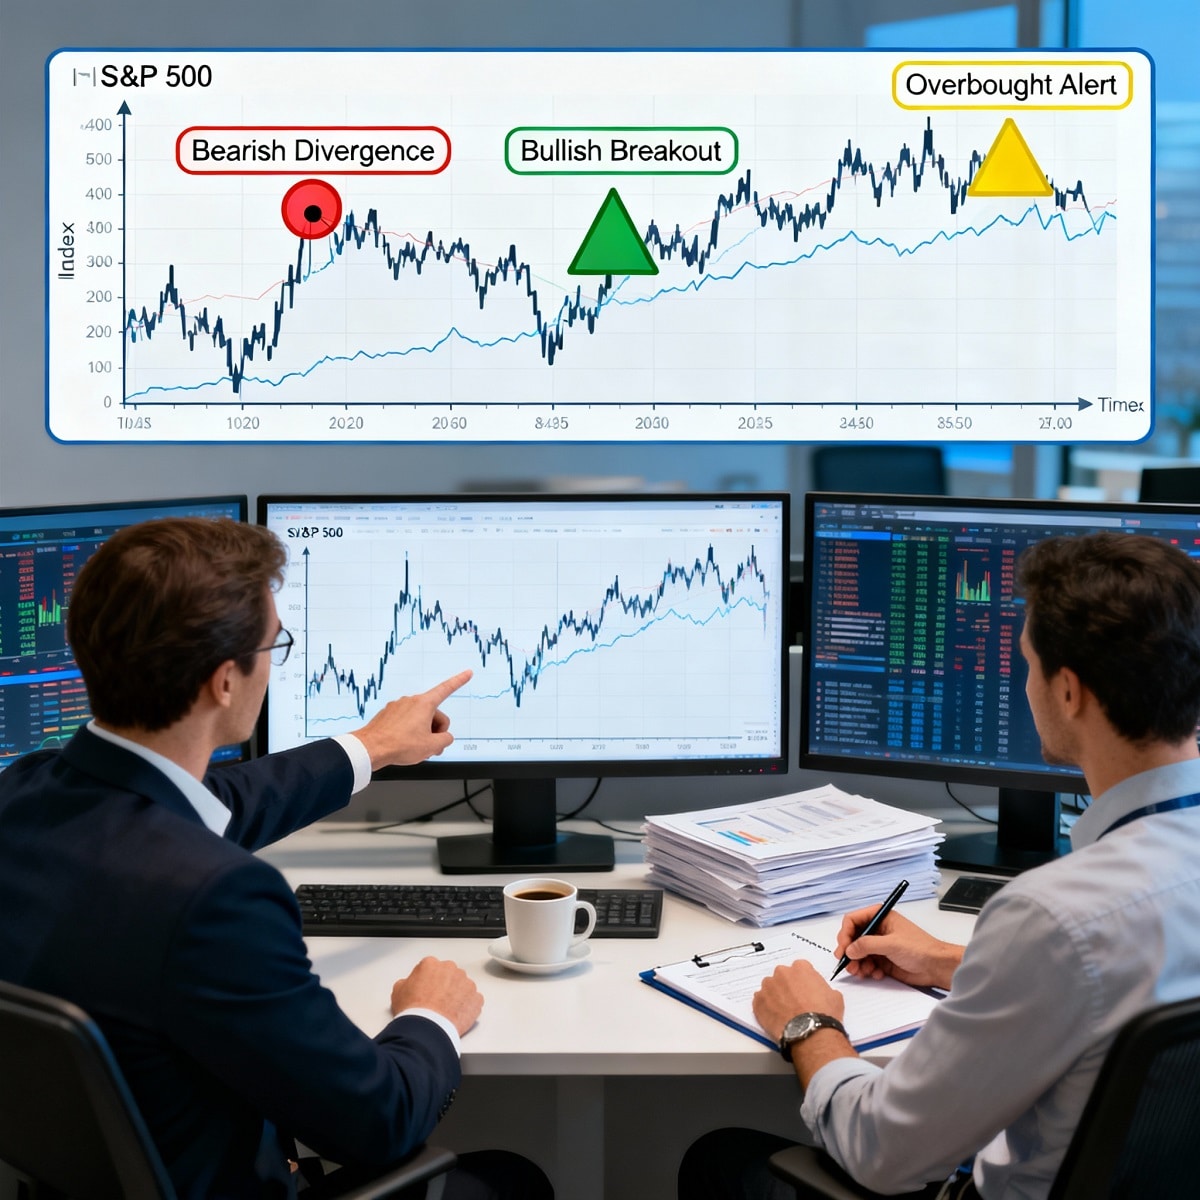
Markets hit fresh highs — here are the three data points traders are watching to tell if the rally has legs or is running out of steam.
Key Takeaways
-
The S&P 500 and Nasdaq just hit fresh highs — but traders aren’t fully convinced the rally is real.
-
Breadth, liquidity, and volatility are the three signals pros are watching to gauge whether momentum can last.
-
Knowing how to read these signs can help you stay invested confidently — or protect gains before sentiment flips.
Markets Are Flying High — But Confidence Isn’t
Let’s be honest — markets at record highs feel great… until they don’t.
Right now, the S&P 500 and Nasdaq have both climbed to new peaks, powered by big tech, AI excitement, and a resilient U.S. economy. The headlines sound euphoric — “Dow hits record!” “Nvidia breaks new highs!” “Fed to cut rates soon!”
But scroll through any investor forum or watch financial Twitter, and you’ll notice something different: skepticism.
Plenty of traders are asking the same question: Is this rally for real, or are we being set up for a correction?
That’s a fair question — especially if you’ve been around long enough to remember the dot-com bubble, the 2008 crash, or even the 2021 “everything rally” that fizzled out fast.
Because when markets surge, they don’t always do it for the right reasons. Sometimes it’s liquidity. Sometimes it’s momentum. Sometimes it’s pure greed.
So how do you know when a rally has real legs — and when it’s running on fumes?
I’ve learned over 25 years of trading that there are three signs every serious investor should watch:
-
Market breadth — who’s actually doing the heavy lifting?
-
Liquidity — is money flowing in or drying up?
-
Volatility — what is the market’s fear gauge whispering behind the scenes?
Let’s break them down one by one.
Sign #1: Market Breadth — Who’s Really Leading the Rally?
Whenever you see the S&P or Nasdaq surging, the first question you should ask is: What’s actually going up?
Because the indexes can make new highs even when most stocks aren’t participating.
That’s what’s called narrow market breadth — when a handful of giant companies (think Nvidia, Apple, Microsoft, Amazon) carry the entire market on their backs.
Right now, we’re seeing a bit of that dynamic. Tech mega-caps are booming, but many mid- and small-cap names are lagging behind.
Why Breadth Matters
Imagine a marathon where only five runners are sprinting while everyone else is walking. It looks like a great race… until those five get tired.
That’s what happens with narrow rallies — they’re vulnerable. When leadership narrows, corrections often follow.
The opposite is a broad rally, where many sectors and companies move higher together. That’s a healthier, more sustainable signal of strength.
What Traders Are Watching
-
Advance-Decline Line (A/D Line): This tracks how many stocks are rising versus falling. If the S&P is rising but the A/D line is flat or falling, that’s a red flag.
-
Equal-Weight S&P 500 (RSP): This index gives every stock the same weight, unlike the traditional market-cap version. If RSP is underperforming, it means small names are lagging.
-
Small-Cap Behavior (Russell 2000): When small caps catch up, confidence spreads. When they don’t, it signals hesitancy.
In short: if more names start joining the party, this rally could be the real deal. But if the same few tech giants keep doing all the work, brace yourself — exhaustion always comes eventually.
Sign #2: Liquidity and Policy Tailwinds
Markets don’t move in a vacuum — they move on money flow.
When liquidity is abundant (from the Fed, corporations, or investors), stocks tend to rise. When it tightens, rallies stall.
It’s that simple.
Right now, the macro backdrop is fascinating. Inflation has cooled, the Fed is signaling potential rate cuts, and bond yields have stabilized. Those conditions are classic fuel for a continued rally.
Why Liquidity Is King
Think of liquidity like oxygen in a room. When there’s plenty, the fire burns bright. When it’s scarce, the flame flickers out.
Even if earnings are solid, a market with shrinking liquidity will struggle. That’s why professional traders constantly monitor:
-
The Federal Reserve’s balance sheet — is it expanding or contracting?
-
Treasury issuance — how much capital is being absorbed by government debt?
-
Corporate buybacks — are companies supporting their own stock prices?
When all three line up positively, it’s a tailwind.
The Liquidity Setup Right Now
Over the last few months, we’ve seen some constructive signals:
-
Fed officials softening their tone.
-
Corporate buyback announcements surging.
-
The dollar stabilizing, encouraging foreign inflows.
But there’s also caution:
-
Bank lending remains tight.
-
Global liquidity outside the U.S. is mixed.
-
Treasury issuance is high, which can drain capital from equities.
So while the environment isn’t hostile, it’s not euphoric either — which makes this a critical watchpoint for traders.
What to Watch This Week
-
Fed statements and minutes: Any hint of a pause or pivot matters.
-
10-Year Treasury Yield: A move below 4% would confirm easing pressure.
-
Money supply data (M2): Subtle shifts here often precede market trends.
If liquidity continues to improve, this rally has support. If it tightens suddenly, expect volatility to spike and risk appetite to fade.
Sign #3: Volatility and Sentiment — The Market’s Mood Swing
The final indicator traders use to test whether a rally is real is volatility — or more specifically, the VIX, often called the market’s “fear gauge.”
When the VIX stays unusually low for long periods, it signals complacency. That’s fine — until it isn’t.
History shows that low volatility plus euphoric sentiment often precede short-term pullbacks. Think late 2017 or late 2021 — both followed by sharp corrections.
But a moderate, steady VIX (say 13–17 range) during an uptrend is usually healthy. It means investors are confident but not delusional.
Other Sentiment Clues to Watch
-
Put/Call Ratios: If everyone’s buying calls, there’s no one left to push the market higher.
-
AAII Sentiment Survey: When bullish sentiment spikes above 45–50%, it often marks short-term peaks.
-
CNN Fear & Greed Index: It’s not perfect, but when it flashes “Extreme Greed,” traders start tightening stops.
How Traders Use This
When the VIX stays below 13 while major indexes make new highs, I start scaling out. When fear returns, I buy back in.
That simple rhythm has saved me from countless drawdowns over the years.
Quick Recap
Let’s sum it up before we talk strategy.
When judging whether an S&P rally is real, traders watch:
-
Breadth — are more stocks joining the move?
-
Liquidity — is money flowing in or drying up?
-
Volatility/Sentiment — is fear too low or creeping back in?
If all three flash green, the rally is strong. If even one turns red, it’s time to get tactical.
Trade Management: How to Stay Smart in This Environment
Now that we’ve covered the “why,” let’s talk about the “what.”
How do you manage positions during a rally like this — especially when you’re not sure how long it will last?
1. Use Trailing Stops
A trailing stop automatically adjusts your exit level as prices rise, protecting profits without cutting upside. For instance, a 10–15% trailing stop on a long-term position can help lock gains if the market suddenly reverses.
2. Take Partial Profits
You don’t need to sell everything. Scaling out of 20–30% of your winners near highs frees up cash while still letting you ride momentum.
3. Rotate into Quality Laggards
When markets broaden, leadership often shifts. Watch for undervalued sectors starting to show strength — like industrials, energy, or small caps catching a bid.
4. Hedge Smartly
If you’re nervous but don’t want to sell, hedge. Short-term put options or inverse ETFs (like SH or PSQ) can offer downside protection while keeping your long positions intact.
5. Keep Cash Optionality
Cash is not “doing nothing.” It’s optionality — dry powder you can deploy when prices correct. The best traders use rallies to build flexibility, not overexposure.
A Word on Mindset
This market rewards patience and punishes panic.
I’ve learned that the best investors don’t chase — they prepare. They don’t ask, “How high can this go?” They ask, “What’s my exit plan when the music stops?”
If you focus on reading the market’s internal signals — breadth, liquidity, and volatility — you’ll rarely be caught off guard.
Case Study 1: The 2020 “Stay-at-Home” Rally — What It Taught Us About Breadth
Let’s rewind to 2020.
The world shut down. Markets crashed. Then suddenly — stocks exploded higher.
But here’s the thing: the S&P 500 hit new highs by August 2020, even though most companies were still struggling. Why? Because five tech giants — Apple, Amazon, Microsoft, Google, and Facebook — drove nearly 25% of the index’s gains.
That was narrow breadth in action.
If you owned those names, you looked brilliant. If you owned almost anything else — small caps, airlines, energy — your portfolio lagged.
By late 2021, that narrow leadership began to crack. Tech started rolling over, inflation spiked, and the S&P corrected over 20% the following year.
Lesson learned: when a rally leans too heavily on a handful of names, it’s fragile.
Fast-forward to 2025 — the setup looks eerily similar.
AI and semiconductor names are carrying the load again. If small caps, banks, and cyclicals don’t join soon, history might rhyme.
Case Study 2: Tesla and the “Liquidity Mirage”
Remember Tesla’s meteoric rise in 2020–2021? It went from roughly $80 (split-adjusted) to over $400 in less than 18 months.
Yes, the story was compelling — EV adoption, Elon’s cult following, a strong narrative. But what really fueled that move?
Liquidity.
Stimulus checks, record-low interest rates, and margin leverage poured money into equities. Retail traders had ammo, and Tesla became their favorite weapon.
When liquidity peaked, so did Tesla.
By 2022, when the Fed began tightening and liquidity drained from the system, the stock fell more than 65%.
That’s why traders today obsess over the liquidity cycle. The market’s ability to keep climbing has little to do with “optimism” and everything to do with the money flow underpinning it.
When liquidity expands, rallies feel invincible. When it contracts, gravity wins.
Right now, with the Fed leaning dovish and global liquidity tentatively improving, traders see a short-term window — but they’re staying nimble, not greedy.
Case Study 3: The AI Mania — When Sentiment Outruns Reality
No discussion of 2025’s rally is complete without talking about AI.
Artificial intelligence has dominated headlines, earnings calls, and investor enthusiasm for over a year. Nvidia’s valuation exploded, chipmakers are booked solid, and AI startups are pulling record funding.
But here’s the uncomfortable truth: sentiment in AI stocks is borderline euphoric.
Even great companies can get overbought when investors price in five years of perfection. That’s why pros watch the VIX, put/call ratios, and earnings revisions closely here.
When sentiment gets stretched, rallies can wobble — even if the long-term story remains intact.
If the S&P keeps climbing while volatility creeps higher, it’s not “fear” — it’s smart money hedging before the crowd.
The “This Time Is Different” Trap
Every cycle has its chorus of believers saying:
“This time is different. The old rules don’t apply.”
In the late 1990s, it was the internet. In 2020, it was zero rates and infinite liquidity. In 2025, it’s AI and automation.
Yes, technology evolves. Economies adapt. But human behavior doesn’t.
Greed and fear still run the show.
That’s why studying market structure — not just market stories — matters. The same signals that worked in 1999 or 2007 still work now:
-
Breadth divergence = warning.
-
Tightening liquidity = warning.
-
Ultra-low volatility + record optimism = warning.
You don’t need to predict the exact top. You just need to see when the odds start tilting against you.
From Guessing to Knowing: The Edge Smart Investors Use
Most retail traders react. They read the headlines, chase the momentum, then panic-sell when volatility hits.
The pros? They anticipate.
They use models that track early warning signals — liquidity cycles, capital flows, insider buying, and global divergence indicators — to spot when markets are shifting before it’s obvious.
That’s exactly the kind of system Jeff Brown and Eric Fry built into their premium research — The Near Future Report and Eric Fry’s Investment Report.
Both analysts focus on the data beneath the narrative: which sectors have true upside, which are peaking, and which hidden plays are still undervalued while the crowd chases hype.
They’ve been early to nearly every major wealth shift in the past decade — from tech megatrends to commodity supercycles.
If you’re tired of guessing whether this rally is “real,” that’s the kind of edge you need.
What Traders Can Do Right Now
Let’s turn analysis into action.
Here’s a simple framework for handling the current rally — whether you’re a long-term investor or an active trader.
1. Check Breadth Weekly
Don’t just look at the S&P’s headline number. Check the equal-weight S&P (RSP), small-cap indexes, and advance-decline lines. If breadth is improving, confidence is too.
2. Monitor Liquidity Data
Keep an eye on the Fed’s balance sheet, repo market trends, and Treasury auction sizes. If liquidity tightens, rallies can evaporate faster than people think.
3. Watch the VIX Like a Hawk
When the VIX starts climbing even as prices rise, that’s often your cue to scale back exposure. When it spikes, look for re-entry opportunities.
4. Use “Profit Discipline”
If a stock has doubled or tripled, trim. Take profits methodically, not emotionally. Remember: no one ever went broke taking a gain.
5. Stay Sector-Agnostic
Don’t marry the story. Tech’s been hot, but if energy or financials show strength, rotate. Markets are dynamic — your portfolio should be too.
The Power of Patterns
Markets change faces but not behavior.
If you study long enough, you’ll notice the rhythm: liquidity → momentum → euphoria → exhaustion → reset → recovery.
The traders who thrive don’t fight that rhythm — they ride it.
In 1999, it was dot-coms.
In 2007, it was real estate and leverage.
In 2021, it was meme stocks and zero rates.
In 2025, it’s AI and soft-landing optimism.
Each rally feels different. But underneath, the signals are always the same.
That’s why frameworks like the one used in The Near Future Report are so powerful — they strip away hype and identify where true innovation meets sound fundamentals.
Why Acting Early Matters
The most valuable investments are almost always uncomfortable at first.
- Amazon looked ridiculous in 2001.
- Tesla was a punchline in 2012.
- Nvidia was “too expensive” at $50 in 2016.
Every major winner starts as a contrarian bet.
But you only see those setups early if you’re looking at data — not headlines.
Right now, multiple megatrends (AI, biotech, energy transition, defense tech) are entering critical acceleration phases. When markets pull back, those are the moments investors like Jeff Brown live for.
Because volatility doesn’t destroy opportunity — it creates it.
Bottom Line: Real Rally or Mirage?
So, is the S&P’s rally real?
The honest answer: parts of it are. But it’s uneven. It’s liquidity-fueled, tech-heavy, and fragile beneath the surface.
The key is not to fear that — it’s to recognize it early and position accordingly.
Traders watching breadth, liquidity, and volatility aren’t trying to predict doomsday. They’re trying to protect capital and catch the next rotation before everyone else.
That’s what separates professionals from tourists.
If you want to know which parts of the market are worth holding — and which are flashing warning lights — I’d encourage you to check out Jeff Brown’s Near Future Report (or Eric Fry’s Investment Report, depending on your focus).
They’re designed for investors who want to play offense intelligently — not chase headlines.
👉 Learn more about The Near Future Report here
👉 Explore Eric Fry’s Investment Report here
Because knowing when to hold and when to rotate could be the difference between riding the next wave… or missing it entirely.
FAQ: S&P 500 Rally — What Investors Are Asking
What’s the main sign this rally is running on fumes?
If market breadth narrows and volatility rises together, that’s your first warning signal. It means leadership is thinning and traders are hedging.
How can I tell when to sell?
Use price discipline, not emotion. Trailing stops (10–15%) or trimming when your gains exceed 50–100% are simple, effective tools.
Are small caps finally ready to lead?
Watch the Russell 2000’s relative strength vs. the S&P. If it starts outperforming for 2–3 weeks straight, that’s your green light.
What happens if the Fed delays rate cuts?
If liquidity doesn’t expand, rallies could pause or retrace. But that’s often when new opportunities emerge in undervalued sectors.
Should I sell everything now?
Absolutely not. This isn’t about panic — it’s about positioning. Reduce risk, take partial profits, and keep dry powder ready for better entries.
Final Thought
Every rally has doubters. But the best traders don’t argue with price — they read its language.
Right now, the charts say: optimism with caution.
That’s exactly the moment when smart investors quietly prepare for what’s next — while everyone else debates whether it’s “too high.”
Stay disciplined, stay curious, and stay early.


