In an era of unpredictable market swings, investors are constantly seeking strategies that promise not just survival but substantial gains regardless of economic conditions.
Enter the Chaikin Power Portfolio, a groundbreaking investment strategy unveiled by Marc Chaikin and Pete Carmasino of Chaikin Analytics.
Touted as a total portfolio solution, this new offering leverages the renowned Power Gauge system to aim for market-beating returns every 90 days.
But with bold claims of potentially doubling the S&P 500’s performance annually—before, during, and after a predicted 2026 market crash—does it truly deliver value for your investment? This review dives deep into the Chaikin Power Portfolio, analyzing its methodology, historical backtesting, promises, and whether it’s worth the $2,500 charter membership price tag.

What is the Chaikin Power Portfolio?
The Chaikin Power Portfolio is a streamlined, 10-position investment model designed to capitalize on short-term market opportunities.
Unlike traditional buy-and-hold strategies, it operates on a 90-day cycle, adjusting its holdings quarterly to align with shifting market trends.
Developed by Marc Chaikin, a Wall Street veteran with over 50 years of experience, and Pete Carmasino, a portfolio management expert, this strategy integrates Chaikin’s Power Gauge—a sophisticated algorithm that rates over 5,000 stocks and 800 ETFs daily as Bullish, Neutral, or Bearish.
The portfolio consists of five top-ranked sector or industry ETFs (the “haystacks”) and five individual stocks (the “needles”) selected from within those ETFs.
This dual approach aims to harness the stability of ETFs and the explosive potential of individual stocks, promising simplicity and agility in volatile markets.
Launched with a dire warning of an impending 2026 crash, the Power Portfolio positions itself as a tool to protect and grow wealth through any market condition—bull runs, corrections, or crashes.
The Backstory: A Response to Market Volatility
Marc Chaikin’s motivation stems from a personal and professional mission to shield investors from the devastating losses he’s witnessed—and experienced—over decades.
He cites his wife Sandy’s 50% loss during the 2008 financial crisis as a driving force behind his work. Coupled with Pete Carmasino’s 25-year pursuit of a “white whale” strategy to exploit short-term opportunities, the Power Portfolio emerges as a response to a market in transition.
As of March 2026, Chaikin highlights a “historic sector rotation,” with money flowing out of tech (down nearly $3 trillion) and into sectors like finance, healthcare, and energy. This shift, he argues, signals the final innings of a bull market, with a crash looming in early-to-mid 2026—a prediction rooted in historical midterm election-year patterns.
The duo emphasizes a grim reality: average investors consistently underperform the S&P 500, losing more in downturns (e.g., 44% vs. the S&P’s 24% in 2022) and gaining less in upturns. The Power Portfolio seeks to break this cycle by offering a proactive, data-driven approach to outpace the market consistently.
How It Works: The Haystack-Needle Strategy
The Power Portfolio’s methodology is elegantly simple yet meticulously calculated. Every 90 days, Chaikin and Carmasino:
1. Scan ETFs: Using the Power Gauge, they identify the top five Bullish sector or industry ETFs poised to outperform over the next quarter.
2. Select Stocks: Within each ETF, Carmasino applies proprietary technical analysis to pick one top-performing stock, resulting in a 10-position portfolio (five ETFs, five stocks).
3. Equal Weighting: Each position receives an equal allocation of capital, rejecting traditional weighted strategies to maximize short-term opportunity over diversification concerns.
This “haystack-needle” approach leverages the Power Gauge’s ability to predict short-term performance (three to six months) across thousands of assets. By focusing on sectors and industries first, they capitalize on the statistic that 50% of a stock’s performance ties to its industry group, then drill down to the strongest individual performers.
Historical Performance: Backtesting Results
Chaikin and Carmasino present seven years of backtested data (2018–2024) to showcase the Power Portfolio’s potential. Here’s a breakdown of their claims:
– Annual Returns: The strategy reportedly outperformed the S&P 500 every year:
– 2018: +19% (S&P -4%)
– 2019: +38% (S&P +31%)
– 2020: +45% (S&P +18%)
– 2021: +58% (S&P +28%)
– 2022: Positive (S&P -18%)
– 2023: +38% (S&P +26%)
– 2024: +55% (S&P +24%)
– Crash Performance: During the 2020 COVID crash, it delivered nine 20%+ winners in Q2, ending the year up 45%. In 2022’s bear market, it yielded gains like 31% on Consol Energy while the S&P fell 16%.
– Growth Potential: A $100,000 investment in 2018 would have grown to $876,000 by 2024, compared to $243,000 in an S&P ETF and $184,000 for the average investor.
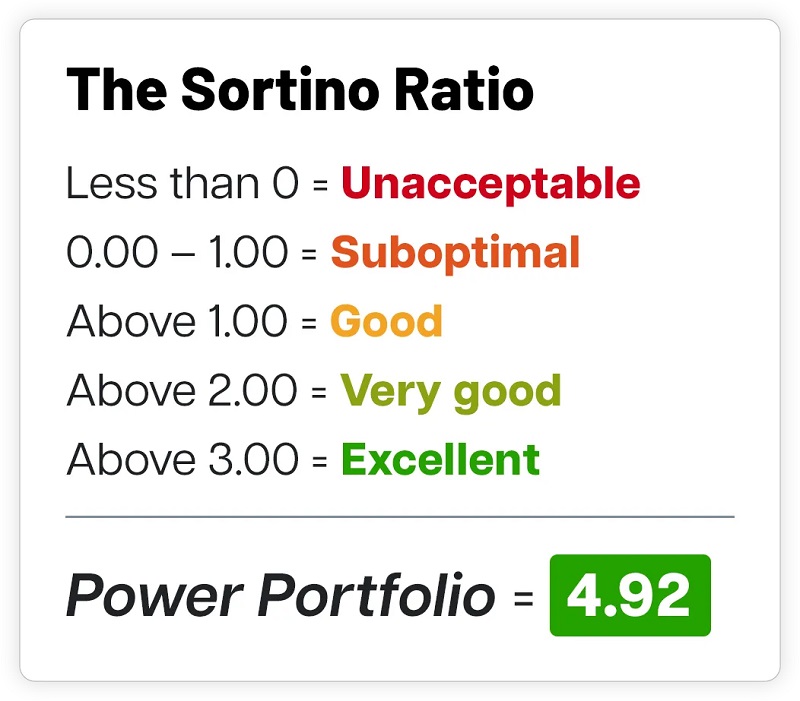
The Sortino Ratio—a metric of risk-adjusted returns for short-term strategies—stands at an impressive 4.92, deemed “beyond excellent” (above 3 is exceptional). Even in its worst quarter (Q1 2020), with two 20% losers, it still beat the S&P, thanks to winners like Nvidia (+12%).
The Promises: Doubling the Market and Crash Protection
The Power Portfolio’s headline promise is bold: the potential to more than double the S&P 500’s performance annually, regardless of market conditions. Chaikin and Carmasino assert it can deliver:
- Pre-Crash Gains: 16 double-digit winners in the 12 months before the 2020 crash; 25 before 2022’s bear market.
- During Crashes: Positive returns in 2020 and 2022, defying market downturns.
- Post-Crash Recovery: Positions like Gilead Sciences (+40% in 90 days) during 2022’s recovery.
They also offer protection via “Chaikin’s 10 Ticking Time Bombs,” a quarterly blacklist of the five weakest ETFs and stocks to avoid.

The Charter Offer: What You Get for $2,500
For a limited-time charter membership, Chaikin Analytics slashes the price from $5,000 to $2,500, bundling $15,498 in value:
– Power Portfolio Subscription: One year of quarterly recommendations, live on March 31, 2026.
– Power Gauge Pro: A bespoke version with the Chaikin Portfolio List tool to track holdings (valued at $5,000).
– Discovery Engine: A Netflix-inspired tool to find stocks similar to favorites (e.g., Dream Finders Homes, +256% vs. Tesla’s +33%).
– Stansberry’s Top 10 Tailwind Stocks: Curated picks from Stansberry Research ($2,000 value).
– 10 Ticking Time Bombs: Quarterly avoidance list.
– Mystery Gift: An undisclosed $2,999 bonus.
– Satisfaction Guarantee: 30-day full credit refund (no cash refunds).
Testimonials from users like Bonnie S. (+230% on one pick) and Greg H. (recovered $50,000 post-2022) bolster its appeal, though disclaimers note that such results aren’t typical and investing carries risks.

Strengths of the Chaikin Power Portfolio
1. Proven System: The Power Gauge’s track record—predicting the 2020 and 2022 crashes and flagging 88 of the top 100 stocks in 2023–2024—lends credibility.
2. Simplicity: Ten equal-weighted positions every 90 days make it manageable for retail investors.
3. Flexibility: Outperformance in bull (2021: +58%) and bear (2022: positive) markets suggests resilience.
4. Risk Management: A high Sortino Ratio and avoidance list mitigate downside risk.
5. Value Proposition: $15,498 in tools and research for $2,500 is compelling if the strategy delivers.
Is It Worth Your Investment?
The Chaikin Power Portfolio offers a tantalizing proposition: beat the market consistently with minimal complexity, backed by a robust system and seasoned experts. Its backtested outperformance—turning $100,000 into $876,000 over seven years—far exceeds the S&P’s $243,000 or the average investor’s $184,000. For active investors comfortable with a $2,500 entry and a short-term mindset, the value is undeniable, especially with bonuses like Power Gauge Pro and the Discovery Engine.
However, skepticism is warranted. Past performance isn’t a crystal ball, and the strategy’s reliance on precise sector rotation and stock picks assumes the Power Gauge’s predictive power holds in uncharted waters. The 2026 crash prediction, while historically grounded, isn’t certain, and unexpected events could test its resilience. Investors must weigh their risk tolerance and financial goals—those seeking passive, diversified growth might find it too aggressive.
Conclusion
The Chaikin Power Portfolio is a bold, innovative attempt to redefine retail investing for a volatile era. It’s not a one-size-fits-all solution but a powerful tool for those willing to embrace its active, data-driven approach.
At $2,500, with a 30-day credit guarantee, it’s a calculated risk worth considering if you believe in Chaikin’s crash thesis and crave market-beating potential. As Marc Chaikin says, it’s about refusing mediocrity—whether it transforms your wealth depends on your faith in their vision and the market’s next moves.
FAQ: Chaikin Power Portfolio
What is the Chaikin Power Portfolio?
The Chaikin Power Portfolio is a 10-position investment strategy designed to outperform the S&P 500 every 90 days. It combines five top-ranked sector or industry ETFs (the “haystacks”) and five individual stocks (the “needles”) selected from those ETFs, using the Power Gauge system developed by Marc Chaikin. It aims to deliver significant gains before, during, and after market crashes by adapting to short-term market shifts.
How does the Power Portfolio work?
Every 90 days, the Power Gauge scans over 5,000 stocks and 800 ETFs to identify the five most Bullish ETFs likely to rise over the next quarter. Pete Carmasino then picks one top stock from each ETF based on his proprietary analysis. The resulting 10 positions are equally weighted, meaning you invest the same amount in each, and the portfolio is rebalanced quarterly to stay aligned with market trends.
Who created the Chaikin Power Portfolio?
It was developed by Marc Chaikin, a Wall Street veteran with over 50 years of experience known for creating the Power Gauge, and Pete Carmasino, a portfolio management expert with 25 YEARS of experience managing money for high-net-worth clients at firms like Prudential and PNC Investments. Their collaboration aims to blend Chaikin’s algorithmic insights with Carmasino’s short-term trading expertise.
What makes this strategy different from traditional investing?
Unlike traditional buy-and-hold strategies that focus on long-term growth and diversification, the Power Portfolio targets short-term opportunities with a 90-day holding period. It avoids bonds, precious metals, or speculative assets like options, focusing solely on ETFs and stocks. This agility allows it to adapt to sector rotations and market volatility, aiming to beat the market consistently rather than just match it.
What are the historical results of the Power Portfolio?
Backtesting from 2018 to 2024 shows it outperformed the S&P 500 every year: +19% in 2018 (S&P -4%), +38% in 2019 (S&P +31%), +45% in 2020 (S&P +18%), +58% in 2021 (S&P +28%), positive in 2022 (S&P -18%), +38% in 2023 (S&P +26%), and +55% in 2024 (S&P +24%). A $100,000 investment in 2018 would have grown to $876,000 by 2024, compared to $243,000 in an S&P ETF.
Can it really make money during a market crash?
Yes, according to backtesting. In 2020’s COVID crash, it delivered nine 20%+ winners in Q2, ending the year up 45%. In 2022’s bear market, it achieved gains like 31% on Consol Energy while the S&P fell 16%. The strategy’s focus on sector rotation and short-term winners aims to capitalize on opportunities even in downturns, though past performance isn’t a guarantee of future results.
What is the Power Gauge, and how does it fit in?
The Power Gauge is Marc Chaikin’s algorithm that rates over 5,000 stocks and 800 ETFs daily as Bullish, Neutral, or Bearish, predicting their performance over the next three to six months. It’s the backbone of the Power Portfolio, identifying top ETFs and stocks to include each quarter. It’s proven its worth by predicting the 2020 and 2022 crashes and flagging 88 of the top 100 stocks in 2023–2024.
How much does it cost, and what do I get for my money?
The charter membership costs $2,500 (a 50% discount from $5,000) and includes a year of Power Portfolio recommendations, Power Gauge Pro (with custom tools like the Chaikin Portfolio List), the Discovery Engine, “Stansberry’s Top 10 Tailwind Stocks” ($2,000 value), “10 Ticking Time Bombs,” monthly updates, and a $2,499 mystery gift—totaling $15,498 in value.
Why is there a crash prediction for 2026?
Marc Chaikin predicts a crash in early-to-mid 2026 based on historical patterns in the four-year presidential election cycle. Data shows midterm election years (like 2026) have a 65% chance of a bear market, with an average 20% loss from post-election years. He cites examples like Reagan’s 1982 bear market and argues this bust follows the current boom, regardless of who’s in office.
What are the risks involved?
Risks include reliance on backtested data, which may not predict future outcomes, and the short-term focus, which could miss long-term trends or increase volatility exposure. There’s no cash refund (only a 30-day credit guarantee), and an unexpected “Black Swan” event could disrupt performance, though Chaikin claims preparedness. All investing carries a risk of loss.
Do I have to buy all 10 positions?
Yes, to match the backtested results, you need to buy all 10 positions (five ETFs and five stocks). Skipping any—especially the ETFs, which Chaikin calls the “secret sauce”—could reduce your edge. The strategy balances risk and reward with this exact mix, avoiding over-conservatism (all ETFs) or excessive risk (all stocks).
What if I miss the quarterly rebalance?
Pete Carmasino says a delay of a few days or even a week or two won’t derail the strategy, as picks are chosen for a 90-day uptrend. The key is to start; late entry won’t negate the potential, but you should aim to align with the quarterly schedule for optimal results.
Is it too good to be true?
The claims are bold—doubling the S&P annually and thriving in crashes—but backed by seven years of backtesting and the Power Gauge’s track record. However, no strategy is foolproof. Skeptics note that past success doesn’t ensure future gains, and the $2,500 price requires confidence in its execution. Testimonials (e.g., Bonnie S.’s 230% gain) suggest potential, but results aren’t typical.
Who should invest in the Power Portfolio?
It’s ideal for active investors comfortable with a $2,500 upfront cost, a short-term focus, and trust in Chaikin’s crash thesis. Long-term, passive investors seeking diversification might find it too aggressive. If you want to beat the market and can handle the risks, it’s worth considering; otherwise, an S&P ETF might suffice.
What happens if there’s a big loss?
Losses are inevitable, as shown in Q1 2020 when two positions fell over 20%. However, the strategy still beat the S&P that quarter due to winners like Nvidia (+12%). The 90-day cycle allows quick pivots to new picks, minimizing the impact of losers, and the high Sortino Ratio (4.92) suggests strong risk-adjusted returns.
Can I use it alongside other strategies?
Yes, Marc Chaikin sees it as additive, not restrictive. It could manage the bulk of your wealth due to its simplicity, but you can pair it with other Chaikin Analytics strategies or personal picks (e.g., using the Discovery Engine to find stocks like Dream Finders Homes, +256%).
How do I get started?
Click here before the charter offer expires. Mark and Pete will release their ten recommendations for Q2 2026 after market-close on Monday, March 30.