Looking for stocks with RSI below 30? These may be oversold and can be added to your watchlist for better investment choices.
Top Stocks with RSI Below 30: Overview
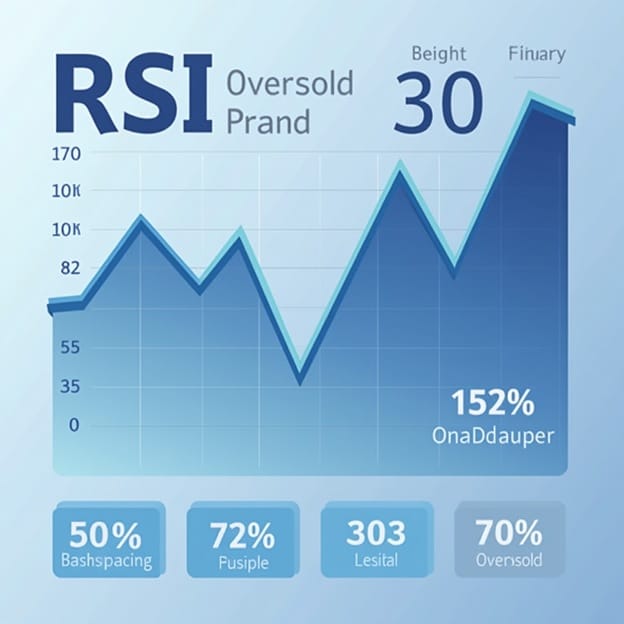
Traders and investors often use the Relative Strength Index (RSI) to measure how fast and how much prices are changing. It goes from 0 to 100 and shows if a stock is being bought too much or sold too much.
If RSI is under 30, it often means the stock could be oversold which might make it a good buy. If you use technical indicators as a trader,stocks with RSI below 30 can help you start trading earlier.
This article will present top stocks with RSI below 30, explain what they mean and discuss the dangers of relying only on RSI. If you are a short-term trader or a long-term investor, these points can help you decide more wisely.
Understanding RSI and the 30 Threshold
The Relative Strength Index (RSI) is used to analyze how fast and strongly a stock’s price is changing. It is shown as a number ranging from 0 to 100 and is usually used to find signals for making buy or sell decisions using momentum.
If the RSI is less than 30, it is usually interpreted as a signal that a stock is oversold and could be worth more or is experiencing a temporary drop in price. The level usually draws the interest of traders who believe the price will turn around or bounce back.
When RSI is below 30, traders look at the stock to see if it might rebound, especially when they check other indicators or analyze the company’s fundamentals. An oversold reading can still occur without the market reversing. At times, a stock stays oversold for a long period because there is still a lot of bearishness or the company’s fundamentals are weak.
Common Misconceptions
- Having RSI below 30 is not always a signal to purchase.
- A drop in price does not always mean the stock is undervalued.
- Using RSI by itself can give you false signals.
It is important to know both the strengths and weaknesses of RSI before making decisions using it.
Why Monitor Stocks with RSI Below 30?
If the RSI for a stock is below 30, traders and investors may find special chances in the market. If the RSI is below 30, it might mean the stock is oversold and could recover or reverse its trend soon. It can be particularly useful for people interested in quick gains or opportunities found in long-term underpriced stocks.
Opportunities for Potential Reversal or Rebound
A reading of RSI below 30 can indicate that the stock has fallen too quickly due to selling pressure which may be more than the fundamentals support. This makes the stock go down more than it should and when buyers return, it can quickly rise again.
Value Investing and Technical Entry Points
Value investors may find stocks in oversold areas appealing when the company’s main strengths are still intact. Using RSI analysis, these dips can be great opportunities for investors to purchase at a low price and keep their investment for a long time.
Historical Examples of RSI Bounce-Backs
Many historical examples show that RSI below 30 often resulted in a strong rise afterward.
- Apple (AAPL) saw its RSI fall below 30 in March 2020 and then bounced back strongly.
- Tesla (TSLA) experienced a number of reversals based on RSI during turbulent periods in 2021.
While there is no promise that past results will repeat, these examples suggest that RSI signals can be useful when used with careful research.
Top Stocks with RSI Below 30 (Current List)
Here are some of the most important stocks with RSI below 30 which is usually seen as oversold and should be kept under observation. Stocks in these sectors might rebound in the short run or offer good value in the long run, based on the state of the broader market.
| Ticker | Company | Sector | RSI Value | Current Price | Recent News / Reason for Dip |
| XYZ | Apha Tech Inc. | Technology | 28.5 | $42.10 | Earnings miss & sector-wide selloff |
| ABC | BetaRetail Corp. | Consumer Goods | 29.3 | $17.85 | Weak quarterly sales report |
| DEF | GreenEnergy Co. | Energy | 2.9 | $9.45 | Oil price volatility |
| GHI | MedLife Pharma | Healthcare | 27.4 | $61.20 | FDA delay on drug approval |
| JKL | UrbanLogistics | Real Estate | 28.1 | $33.60 | Interest rate hike fears |
Brief Analysis of Each Pick
- XYZ (AlphaTech Inc.): A major tech company saw its stock fall after reporting earnings that were below expectations. Wider industry-level weakness is affecting how the company performs.
- ABC (BetaRetail Corp.): Retail stock is expected to fall after Q1 sales were lower than expected, although the company did well during the holidays.
- DEF (GreenEnergy Co.): The recent changes in energy prices have made this clean energy stock oversold.
- GHI (MedLife Pharma): The healthcare firm is experiencing a short-term setback because of delays in regulations, yet it has a promising lineup of products.
- JKL (UrbanLogistics): Uncertainty about interest rates is influencing real estate-focused REITs and RSI points to a possible support zone.
These RSI below 30 stocks should not be bought right away — but you might want to keep an eye on them for more analysis.
How to Analyze These Oversold Stocks Further
If RSI is below 30, it may mean the stock is oversold, but you should not depend only on this indicator. Analyzing a company using both technical and fundamental tools helps you identify the real opportunities from those that may be fake.
Combine RSI with Other Technical Indicators
To confirm whether an RSI signal is reliable, combine it with:
- MACD (Moving Average Convergence Divergence): Helps identify momentum shifts and trend reversals.
- Volume Analysis: A bounce with strong volume adds credibility to the signal.
- Moving Averages (50-day/200-day): Check if the price is near key support levels or moving average zones.
These indicators, when aligned with RSI below 30, strengthen your case for a potential rebound trade.
Check Fundamentals
If you want to keep a stock for a long time, it should still have strong fundamentals, even if it’s technically oversold. Important points to check are:
- Earnings Reports: Are revenues and profits growing or declining?
- Debt Levels: High debt could indicate financial stress.
- P/E Ratio: Compare with industry averages to assess valuation.
Strongness in the market during a technical dip usually points to a short-term correction, not a lasting downtrend.
Avoiding Value Traps
A stock can be oversold without being undervalued. There are companies that are cheap because their business models are weak, they have lawsuits, their management is poor or they are expected to perform poorly in the future. They are examples of value traps.
To avoid them:
- Look into the reason the RSI is low such as recent news, changing trends or earnings results.
- Make sure you see reversal signals before you buy.
- Always set stop-loss orders to reduce your risks.
Doing a complete check helps you avoid just buying something cheap and instead choose wisely.
Risks Involved in Trading Based on RSI Alone
Relying on RSI alone can be dangerous since it sometimes provides incorrect signals. Even if RSI is below 30, showing oversold conditions, the stock price could still decline due to things happening in the market or within the company.
Why RSI Can Give False Signals
- It doesn’t consider big events such as poor earnings or new regulations.
- Sometimes, when the market is falling strongly, the RSI remains oversold for a long period which can lead to buying early.
- It just tracks momentum, not the reasons behind prices going up or down.
Importance of Risk Management
Good traders do not depend only on one indicator. They put stop-loss rules in place, manage their position sizes and spread their investments to prevent big losses if the trade goes wrong. Having a good risk strategy protects your money even if the technical signals are not accurate.
Avoiding FOMO (Fear of Missing Out)
Being impulsive can happen when you trade a stock only because its RSI is below 30. Be patient and look for confirmation, use several indicators and keep to your trading plan. Do not rush into buying oversold stocks just because you heard about them.
Pro Tips for Spotting Quality RSI Setups
RSI is valuable, but using it together with other techniques and knowing its details can assist you in finding better chances to trade.
Ideal Chart Patterns to Combine with RSI
Check for well-known reversal or continuation patterns that confirm what RSI is suggesting, for example:
- Double bottoms or double tops. When the RSI is either very low or very high, they can indicate a strong reversal point.
- If price moves in the opposite direction to RSI, it can indicate that a trend reversal is about to happen.
- Signals given by RSI are often more reliable close to the support and resistance levels.
Intraday vs Swing Trading with RSI
- Intraday Traders: If you want quick signals for entering and exiting trades, use a short RSI (such as 5 or 7) on 5- or 15-minute charts.
- Swing Traders: The standard 14-period RSI on daily charts is best for seeing medium-term trends and avoiding unnecessary signals.
Change your RSI settings and trading timeframe to fit your style to get better results and fewer false signals.
RSI on Different Timeframes
Look at RSI on different timeframes to get a better understanding.
- A stock that appears oversold each day but neutral each week may still be part of a bigger downtrend.
- Seeing oversold RSI on both short- and long-term charts makes the trade setup more reliable.
A multi-timeframe strategy helps you avoid being trapped and find better opportunities.
Conclusion
In brief, stocks with RSI below 30 might indicate that the price is low, but you should still use other technical and fundamental tools to decide. RSI by itself should not be seen as a sure buy signal; you need to look at the situation and understand the risks.
Always take time to research and think about your own ability to handle risks before investing. Because markets may stay irrational for a longer time than you anticipate, you need to stay patient and disciplined.


