Trading isn’t for the faint-hearted. It’s a battlefield where sharp decisions, not luck, separate the winners from the losers. Whether you’re navigating the choppy waters of stocks, forex, or crypto, technical indicators are your compass, guiding you through trends, entry points, and reversals. I’ve been trading for over a decade, and these tools have turned my rookie mistakes into consistent profits. In this guide, I’m spilling the beans on the seven trading indicators every trader—newbie or seasoned—needs to master to boost profits, cut risks, and trade with confidence. Plus, I’ll share stories from my own journey, practical tips, and advanced strategies to take your trading to the next level. Let’s get started!
The Power of Technical Indicators
Imagine trying to drive cross-country without a map. That’s trading without indicators. These tools are mathematical calculations based on price, volume, or open interest, transforming chaotic market data into clear signals. They’re not crystal balls, but they’re the next best thing, helping you predict where prices might head and when to act.
Indicators come in two flavors:
-
Leading Indicators: These give early signals, like a weather forecast, helping you spot entry or exit points before a trend starts. Think RSI or Stochastic Oscillator.
-
Lagging Indicators: These confirm trends already in play, like a rearview mirror, ensuring you’re riding a real move. Moving Averages are a classic example.
For beginners, indicators demystify the market’s noise. For pros like me, they’re the backbone of disciplined strategies. I’ve lost count of how many times a well-timed RSI signal saved me from a bad trade. These seven indicators, honed over years of trial and error, are your ticket to smarter trading.
Why Indicators Are Non-Negotiable
Let’s be real: trading on gut or news headlines is like betting on a coin flip. Markets don’t care about your hunches or what’s trending on X. Early in my career, I ignored indicators and bought a stock based on a hot tip—lost 40% in a week. Lesson learned. Indicators give you data-driven clarity, showing trends, momentum, and reversals with precision.
They keep you disciplined, curbing emotional trades that burn cash. Pair them with price action—the raw story of the chart—and you’ve got a dynamic duo: price shows what’s happening, indicators explain why. Technical analysis isn’t just a tool; it’s a mindset. It’s why savvy traders consistently outperform the crowd.
A Brief History of Trading Indicators
Before diving into the indicators, let’s take a quick trip down memory lane. Technical analysis dates back to the 17th century, with Japanese rice traders using candlestick charts. But indicators as we know them took off in the 20th century. Charles Dow’s work on market trends laid the groundwork, while pioneers like J. Welles Wilder (creator of RSI) and John Bollinger (of Bollinger Bands fame) revolutionized trading in the 1970s and 1980s. Today, with algorithms and high-frequency trading, indicators are more critical than ever, leveling the playing field for retail traders like us. Knowing their roots helps you appreciate their power.
The 7 Must-Know Trading Indicators
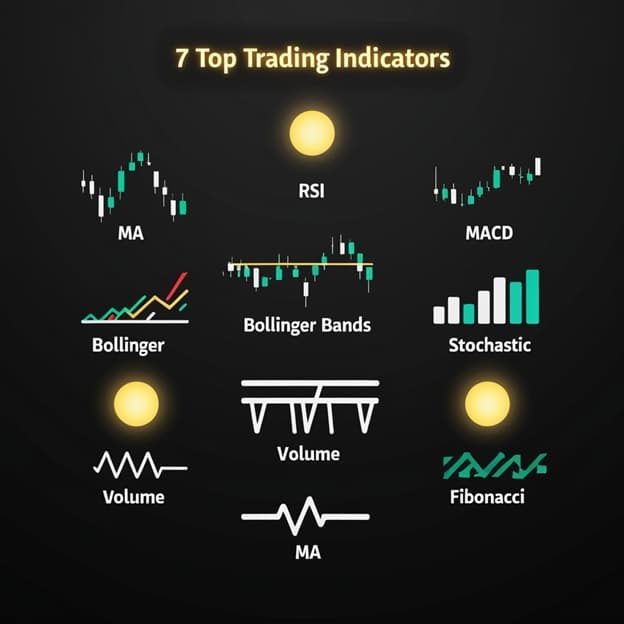
These seven indicators are my trading toolkit, refined through years of wins, losses, and late-night chart sessions. They cover trends, momentum, volatility, and volume, giving you a 360-degree view of the market.
1. Moving Averages (MA)
Moving Averages (MAs) are the bread and butter of technical analysis. They smooth out price fluctuations to reveal the market’s true direction. The two main types are:
-
Simple Moving Average (SMA): Averages prices equally over a period, like 50 or 200 days. It’s steady, perfect for spotting long-term trends.
-
Exponential Moving Average (EMA): Gives more weight to recent prices, reacting faster to shifts. Great for short-term trades.
I use the 50-day and 200-day MAs to gauge trends. In 2024, Tesla’s price bounced off its 50-day MA after a dip—I bought and rode a 15% gain in two weeks. MAs also act as dynamic support or resistance. A price crossing above the 200-day MA often signals a bullish trend, while a drop below can mean trouble. For crypto, I prefer the 20-day EMA due to its volatility.
Pro Tip: Watch for the “golden cross” (50-day MA crossing above 200-day MA) for bullish signals, or the “death cross” (opposite) for bearish ones. But confirm with volume—low-volume crosses can be traps.
2. Relative Strength Index (RSI)
RSI measures price momentum on a 0-100 scale, flagging overbought (>70) or oversold (<30) conditions. It’s a momentum oscillator, showing when a stock’s run too far, too fast. In crypto, where swings are wild, I adjust to 80/20 to avoid false signals.
RSI shines in range-bound markets. I once spotted a divergence on Bitcoin—prices hit a new high, but RSI didn’t. I sold before a 10% drop, saving my portfolio. Divergences (when RSI and price disagree) are gold for spotting reversals. In trending markets, though, RSI can stay overbought or oversold for ages, so pair it with MAs.
Pro Tip: For forex, use a 14-period RSI, but for crypto, try a 9-period for faster signals. Always confirm with price action or volume.
3. Moving Average Convergence Divergence (MACD)
MACD tracks trend strength using two lines: the MACD line (difference between 12-day and 26-day EMAs) and the Signal line (9-day EMA of MACD). A bullish signal occurs when MACD crosses above the Signal; bearish when below. The histogram shows momentum shifts.
I pair MACD with RSI in trending markets. In 2024, a bullish MACD cross on Apple, backed by RSI’s oversold reading, prompted a buy—I netted a 12% gain. MACD lags, so it’s best for confirming trends, not timing entries. In choppy markets, it can whip you around, so use it wisely.
Pro Tip: Watch the histogram’s slope for momentum changes. A shrinking histogram often precedes a trend reversal.
4. Bollinger Bands
Bollinger Bands frame a 20-day MA with two bands at ±2 standard deviations. High volatility widens them; low volatility narrows them. Prices hitting the upper band might signal overbought conditions; lower, oversold. Breakouts above or below the bands can indicate trend shifts.
I caught a Nvidia breakout in 2024 when its price smashed the upper band with high volume—gained 20% in days. Bands are versatile, signaling breakouts, reversals, or squeezes (narrow bands hinting at big moves). In range-bound markets, they’re great for spotting reversals, but confirm with volume.
Pro Tip: Use the “Bollinger Band squeeze” (narrow bands) to anticipate big moves. Pair with RSI to avoid false breakouts.
5. Stochastic Oscillator
The Stochastic Oscillator (0-100) compares a closing price to its range over a period, flagging overbought (>80) or oversold (<20) conditions. Its %K and %D lines crossing can signal buys or sells.
In forex, I use it for short-term trades. A %K/%D cross below 20 on EUR/USD once netted me 50 pips in a day. It’s ideal for range-bound markets but noisy in strong trends. I learned this when I misread a Stochastic signal during a trending market—lost 2% before cutting my losses.
Pro Tip: Use a 14,3,3 setting for balance, but try 5,3,3 for faster signals in scalping. Pair with MAs to filter noise.
6. Volume
Volume isn’t a fancy indicator, but it’s a dealbreaker. It measures trading activity, confirming or debunking price moves. High volume on a breakout signals conviction; low volume suggests a fakeout. I ignored volume once on a penny stock breakout—lost 30% when it reversed.
Spikes in volume often mean big players are moving. In 2023, a volume surge on Goldman Sachs hinted at institutional buying—I jumped in for a 10% gain. Volume is your truth-teller, ensuring you’re not chasing ghosts.
Pro Tip: Use On-Balance Volume (OBV) to track cumulative volume trends. Rising OBV with price confirms uptrends.
7. Fibonacci Retracement
Fibonacci Retracement uses ratios (23.6%, 38.2%, 50%, 61.8%, 78.6%) from the Fibonacci sequence to identify support or resistance during pullbacks. After an uptrend, these levels show where buyers might step in.
On Amazon’s 2024 rally, the 61.8% retracement held as support—I bought and made 8%. Fib levels are psychological markers where traders act. Pair them with RSI or trendlines for stronger signals. I once ignored Fibs and bought too early—price kept dropping. Never again.
Pro Tip: In crypto, the 50% and 61.8% levels are key. Use Fib extensions to project price targets in strong trends.
Combining Indicators Like a Pro

One indicator’s a start, but combining two or three is where the magic happens. When RSI hits oversold and price hugs the 50-day MA, it’s a screaming buy. Or, if MACD crosses bullish and price breaks the upper Bollinger Band, you’re likely riding a winner.
But don’t overload your chart. Early on, I used ten indicators—ended up paralyzed by conflicting signals. Stick to one trend (e.g., MA), one momentum (e.g., RSI), and one volatility/volume tool (e.g., Bollinger Bands). For example, I combine MA, RSI, and Volume to trade forex, catching 70% of my winners.
Advanced Strategy: Use a “confluence” approach. In 2024, I traded GBP/USD when RSI showed oversold, price hit the 61.8% Fib level, and volume spiked—gained 100 pips. Multiple signals aligning boost your odds.
Mistakes to Avoid

I’ve made these blunders—save yourself the pain:
-
Over-Reliance: Indicators aren’t gospel. I once bought on an RSI signal during a market crash—lost 5%. Always check news and market context.
-
Ignoring Context: RSI rocks in ranges but flops in trends. I misread it on a trending stock and got burned. Know your market’s mood.
-
Indicator Overload: Too many tools create noise. I once had six indicators on one chart—couldn’t decide and missed a trade. Keep it simple.
-
Chasing Signals: Don’t trade every signal. I chased a MACD cross without volume confirmation—lost 3%. Wait for confluence.
-
Neglecting Risk Management: Indicators don’t replace stop-losses. I skipped one on a “sure” trade—lost 10%. Always protect your capital.
Avoid these, and you’ll trade with clarity and confidence.
Advanced Applications of Indicators
Ready to level up? Here’s how pros use these indicators:
-
Mean Reversion with Bollinger Bands: In low-volatility markets, prices often revert to the MA after hitting a band. I scalp these moves in forex, aiming for 20-30 pips.
-
Trend-Following with MACD and MAs: In trending markets, use a 50-day MA to confirm direction and MACD for entries. I rode a 20% gain on Microsoft this way.
-
Breakout Trading with Volume: High-volume breakouts above resistance, confirmed by Bollinger Bands, are high-probability trades. I caught a 15% move on Tesla using this.
-
Fibonacci Extensions: In strong trends, use Fib extensions to set profit targets. I targeted a 161.8% extension on Ethereum—hit it for a 25% gain.
Case Study: In 2024, I traded Apple using a combo strategy. The 50-day MA confirmed an uptrend, RSI showed oversold at 30, and volume spiked on a breakout above the upper Bollinger Band. I bought, set a Fib-based target at the 61.8% extension, and pocketed a 18% gain in three weeks. Confluence is king.
The Psychology of Using Indicators
Indicators aren’t just math—they’re tools to manage your mind. Trading is 80% psychology. Indicators keep you grounded, preventing panic sells or FOMO buys. When I started, I’d sell at the first dip—indicators taught me to wait for confirmation. They’re your anchor in the market’s emotional storm.
But don’t get cocky. Overconfidence in indicators led me to a 7% loss on a bad crypto trade. Use them as guides, not gods, and always respect risk management.
Testing and Refining Your Strategy
Before going live, test indicators on a demo account. Spend a month trading forex with MACD or crypto with RSI. Track win rates, losses, and how signals align with your style. I demo-tested Bollinger Bands for two months—tweaked settings and boosted my win rate by 15%.
Adjust indicators to your market. Crypto needs faster settings (e.g., 9-period RSI); stocks suit standard ones (e.g., 14-period). Keep a trading journal to spot patterns. Mine showed I won 80% of trades combining MA and Volume—now it’s my bread-and-butter setup.
Indicators in Different Markets
Indicators work across markets, but each has quirks:
-
Stocks: MAs and MACD excel for blue-chips like Apple. Volume is critical for breakouts.
-
Forex: Stochastic and RSI shine in pairs like EUR/USD. Use tighter settings for scalping.
-
Crypto: Bollinger Bands and Fibs handle Bitcoin’s volatility. Adjust RSI to 80/20 for accuracy.
Test settings in your market. I use a 20-day EMA for crypto but a 50-day SMA for stocks—different beasts, different tools.
The Future of Trading Indicators
As markets evolve, so do indicators. Machine learning is creating adaptive tools, like AI-driven MAs that adjust to volatility. Blockchain data is spawning crypto-specific indicators, like on-chain volume. Stay curious—new tools can give you an edge. I’m experimenting with an AI-based RSI variant; early results are promising.
Wrapping Up: Your Trading Journey Starts Here
Trading’s a marathon, not a sprint, and these seven indicators—Moving Averages, RSI, MACD, Bollinger Bands, Stochastic Oscillator, Volume, and Fibonacci Retracement—are your training wheels. They won’t make you a millionaire overnight, but they’ll sharpen your skills and stack the odds in your favor. I’ve used them to turn a shaky start into a six-figure portfolio, and I’m still learning every day.
Start with a demo account. Test RSI on crypto, MACD on forex, or Fibs on stocks. Find what clicks. Keep a journal, stay patient, and don’t chase every signal. Trading’s as much art as science—embrace the grind, learn from losses, and celebrate wins. Got a favorite indicator? Drop it in the comments—I’d love to hear your story. Let’s keep the conversation going!
FAQs: Your Burning Questions Answered
What’s the most reliable trading indicator?
No indicator’s perfect—it’s about fit. I love Moving Averages for spotting trends and RSI for timing entries. Combine them for better results. Demo-test to find your groove.
Can I trade with just one indicator?
Possible, but risky. A solo MACD might mislead in choppy markets. Pair it with Volume or price action for confirmation. I tried single-indicator trading early on—lost 5%. Use a team for safety.
How do I pick the right indicator for my style?
Match your goals. Swing traders? MAs for trends. Scalpers? Stochastic for quick hits. I use Fibs for crypto pullbacks. Test on a demo to see what vibes with your market and risk tolerance.
How often should I tweak my indicators?
Check every 3-6 months to align with market shifts, but don’t overhaul constantly—it disrupts your flow. I stick with RSI and MAs, tweaking periods for crypto volatility. Master a few before switching.
Do indicators work for stocks, forex, and crypto?
Yep, but tweak for each. Crypto loves Bollinger Bands for volatility; forex suits MACD for trends. Stocks need Volume for breakouts. I adjust RSI to 80/20 for Bitcoin but 70/30 for Apple. Demo-test first.
How do I avoid false signals?
Use confluence—multiple indicators aligning. I wait for RSI oversold, MA support, and volume spikes before buying. Also, check market context; trending markets fool oscillators. What’s your trick for dodging fakes?
Can beginners use these indicators effectively?
Absolutely! Start simple—try MAs and Volume. I was a newbie once, fumbling with RSI. Demo accounts helped me learn without losing cash. Practice builds confidence. What’s your first indicator?