Most investors love to buy winners, but few know how and when to sell them. In times of high market volatility, selling strong stocks—even the ones you don’t want to part with—can be a winning strategy for protecting and growing your portfolio. While conventional wisdom says “let your winners run,” that advice only works when markets are trending steadily. In our current climate, with big indexes swinging in both directions, it pays to be flexible and lock in those hard-earned gains before sentiment reverses.
This article covers four outstanding stocks—Oracle, Pagaya, Robinhood, and Oklo—that have each delivered outsized returns this year but are flashing sell signals as volatility ramps up. We’ll use technical analysis, macro insights, and sector trends to show why profit-taking could be the right move right now.
Understanding Market Volatility in 2025
Global Macroeconomic Factors
2025 began with optimism. AI breakthroughs, tech megadeals, robust consumer spending, and a rebound in international trade gave major U.S. indices the inertia to hit new highs. Yet “higher for longer” interest rate policy from the Federal Reserve, stubborn inflation, and unresolved diplomatic tensions (East Asia, Middle East, Ukraine) quickly injected fear into the system.
-
Central banks worldwide are tightening monetary policy after two years of easy money.
-
Geopolitical hotspots keep energy and commodity markets unstable.
-
Dollar strength weighs on multinational profits while compressing margin forecasts.
Federal Reserve and Interest Rates
Fed guidance remains carefully ambiguous, with policymakers balancing inflation management and recession risk. In 2025, rate hikes paused, but hints of further increases flash warnings across tech and growth stocks—those most sensitive to borrowing costs.
-
Elevated rates make debt financing expensive, affecting companies like Oracle and Oklo.
-
Higher rates tend to compress valuations, prompting big money to rotate into value and defensive stocks.
-
Cash-rich firms find more opportunities to acquire struggling competitors.
Sector Winners and Losers
While the S&P 500 remains near highs, sector leadership is shifting:
-
Tech giants and AI-driven companies posted dazzling gains early, but recent sell-offs hit the most expensive names hardest.
-
Financials and fintechs—including Pagaya and Robinhood—have been standout winners, but concerns about credit quality and regulatory scrutiny now add pressure.
-
Clean energy and nuclear themes (Oklo) soared on new legislation, but are now grappling with execution risk and lagging financial performance.
The Psychology of Profit-Taking: When to Sell Your Best Stocks
Selling a winning stock is emotionally difficult. Investors fear missing further gains, regret selling too soon, and sometimes ignore warning signs of reversals. Behavioral finance research shows that our minds are wired to “hold on” longer than is rational. Smart profit-taking involves:
-
Setting target prices and stop-loss levels when entering a trade.
-
Using “trailing stops” to lock in profits while giving winners room to run.
-
Heeding technical indicators—like moving average breaks and momentum shifts.
-
Revisiting your thesis: If the reason you bought the stock has changed, be ruthless about selling.
Stock #1: Oracle Corporation (ORCL)

Company Overview and Recent Performance
Oracle is a legacy tech giant with a reputation for successful pivots. In 2025, the company made headlines by partnering with OpenAI in what is arguably the largest artificial intelligence deal to date, worth $300 billion over five years.
Its cloud services, enterprise software, and AI infrastructure have put it at the heart of the digital transformation wave. Oracle’s quarterly revenues smashed analyst targets, and the stock delivered a near-vertical rally.
The OpenAI Partnership: Boom & Bust Potential
Oracle’s global infrastructure became the backbone for OpenAI’s large-scale deployments. Investor enthusiasm drove the share price to historic highs—up 35% in one day, and nearly doubling over six months.
Yet, rapid growth often breeds excess. As the euphoria faded, skeptics scrutinized:
-
Deal Structure: Financing such a massive project involved leveraging debt, raising doubts about sustainability and profit margins.
-
Competitive Position: While OpenAI is the AI darling, rivals like Microsoft and Google have more diversified and durable demand sources.
-
Analyst Warnings: Some top analysts call Oracle’s move “irresponsible” compared to healthier models at competitors.
Technical Analysis: Valuation, Moving Averages, MACD, RSI
Fundamental overextension is now matched by technical breakdowns:
-
Valuation: Shares trade at more than 52 times earnings and over 8 times book value—far above peers and historical averages.
-
50-Day SMA: Oracle recently broke below the 50-day simple moving average, a classic short-term bearish signal after an overheated run.
-
MACD: Moving Average Convergence Divergence shows negative momentum building, suggesting momentum players are exiting.
-
200-Day SMA: The next support level, with a break potentially triggering a bigger correction.
Fundamental Risks
-
Debt Leverage: Oracle faces sharply rising interest expense, potentially compressing net income even as top-line growth impresses.
-
AI Margin Uncertainty: Analysts question whether the AI deal will produce healthy margins long-term, especially with rising costs.
Future Outlook and Price Targets
-
Expect volatility as the market digests the full financial impact of Oracle’s ambitions.
-
This is a classic “sell into strength” candidate—capture gains before any sustained drop as technical and fundamental pressures mount.
Stock #2: Pagaya Technologies (PGY)
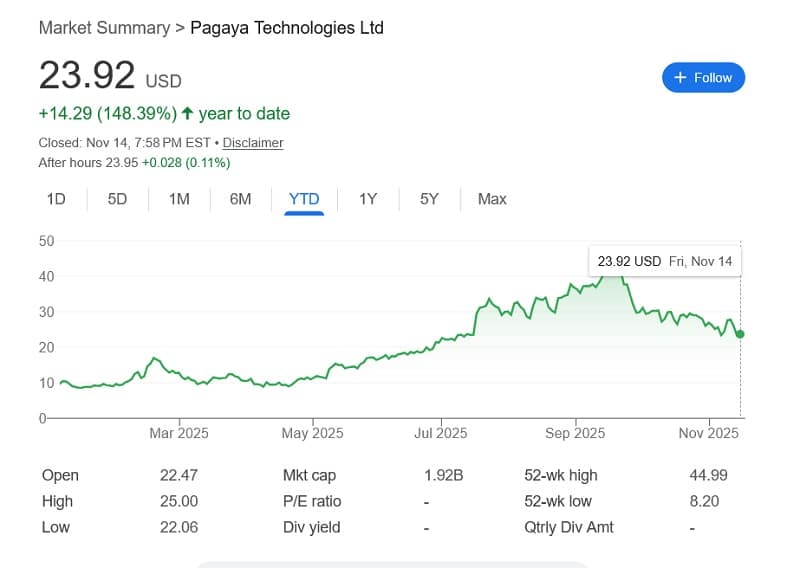
What Makes Pagaya Special?
Pagaya is an AI-powered fintech, providing advanced machine learning systems to banks, credit unions, and asset managers. The company is a quiet YTD standout, with a market cap of $1.88 billion and annual sales approaching $1 billion.
AI/Fintech Sector Trends in 2025
-
AI adoption accelerated in banking, risk management, and asset allocation.
-
Fintech winners delivered massive YTD gains, often far outpacing the sector average.
-
Investor focus has shifted from pure growth to sustainable earnings and credit risk.
Earnings and Credit Quality Concerns
Pagaya posted Q3 sales and profits well ahead of analyst expectations but delivered a warning: credit impairment charges are rising, and near-term challenges are looming.
-
The relief rally post-earnings (12% surge) vanished in two sessions, signaling investor anxiety.
-
Forward earnings remain strong, but cracks in credit quality could lead to wider losses if recession fears grow.
Technical Signals and Chart Analysis
Chart watchers spotted several negatives:
-
Pagaya followed the 50-day SMA as support for nearly two quarters, but a September breakdown triggered a 25% rout in under two weeks.
-
RSI is trending down but not yet “Oversold,” a sign that bears may have more fuel.
-
The 200-day SMA is now a key battleground—losses below this level could confirm a new downtrend.
Possible Scenarios After Current Decline
-
If credit conditions worsen, expect further volatility and downside.
-
Should sentiment improve, recovery will need to overcome resistance at the 50- and 200-day SMAs.
Stock #3: Robinhood Markets Inc (HOOD)
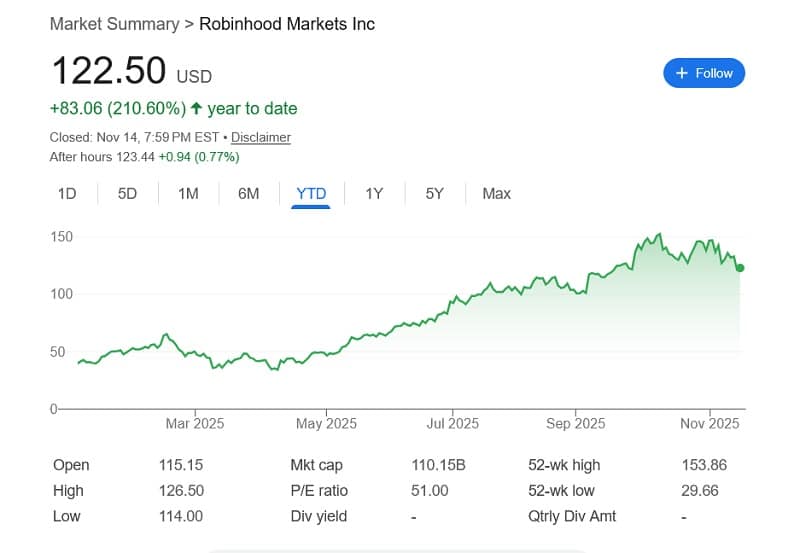
Robinhood’s Business Model Evolution
Since its founding, Robinhood disrupted retail investing with commission-free trading, an addictively simple app, and a brand focused on democratizing finance. Its user base—now in the millions—has driven extraordinary top-line growth in both bull and bear cycles.
The 2025 Earnings Explosion
Robinhood’s Q3 2025 report was nothing short of spectacular:
-
Revenues shattered estimates, topping $1.27 billion—a doubling year-over-year.
-
EPS soared from $0.17 to $0.61, handily beating analyst projections and broadening the moat between Robinhood and conventional brokers.
Crypto and Options: Double-Edged Swords
Two products now anchor Robinhood’s growth narrative:
-
Crypto Trading: Robinhood remains a go-to platform for first-time Bitcoin and Ethereum traders. But as Bitcoin and Ethereum spent much of 2025 in a holding pattern, Robinhood’s fee income plateaued—even as volatility brought more users into the fold.
-
Options Trading: Robinhood has become a hotspot for zero-commission options trades, powering both growth and criticism for “gamifying” risk.
Both segments provide explosive revenue upside during market momentum, but are deeply cyclical and sensitive to macro, regulatory, and sentiment shocks.
Speculation Risks & Technical Warning Signs
While fundamentals remain impressive, Robinhood’s stock now faces several sell indicators:
-
After hugging the 50-day SMA for months, HOOD recently lost this crucial support, a classic technical red flag.
-
The Relative Strength Index (RSI) has trended lower, matching waning momentum across high-beta assets.
-
Robinhood’s reliance on speculative flows (crypto, meme stocks, options) means a sudden volatility shock could trigger outflows and multiple contraction.
Macro Headwinds for Fintech Stocks
-
Regulation: Increased scrutiny on options, margin trading, and crypto assets remains a major overhang.
-
Interest Rate Sensitivity: As “risk-on” appetite for fintech falters in a rising-rate environment, stocks like HOOD may correct rapidly.
-
Competitive Pressures: Traditional brokers now offer many “Robinhood features,” further compressing margins.
-
Liquidity Events: Retail traders typically pull back fastest after a correction—potentially compounding a sell-off.
Strategic Outlook and Sell Tactics
-
Partial profit-taking makes sense after such a major run-up; trailing stops can protect remaining upside.
-
Watch the 200-day SMA—failure to regain this level suggests longer-term momentum is broken.
-
Re-invest proceeds into less-volatile financials, or into new positions after the next base is built.
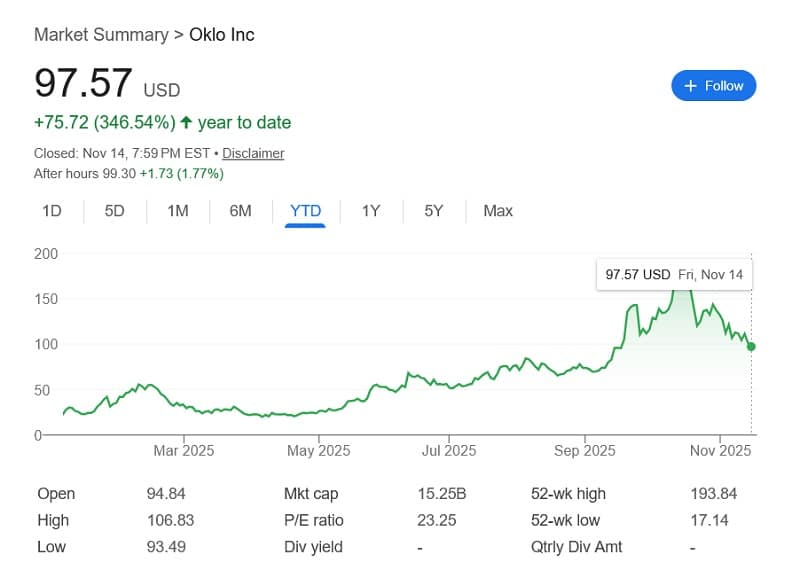
Stock #4: Oklo Inc (OKLO)
The Nuclear Energy Rethink
Nuclear power, long marginalized, returned to center stage in 2025 as policymakers grappled with climate change, energy security, and runaway data center demand. The “One Big Beautiful Bill Act” (OBBBA) unlocked huge subsidies for next-gen nuclear innovation, and Oklo’s small modular reactor (SMR) promise caught fire.
Oklo’s Unique Position
Oklo’s modular designs promise:
-
Rapid deployment
-
Cost savings versus traditional nuclear
-
Scalability for non-utility clients (data centers, industrial parks, even crypto miners)
That narrative—plus government tailwinds—supercharged the stock from $20 to $170 between April and October 2025.
Deep Dive: Financials, Losses, Project Timelines
-
Despite surging shares, Oklo generated zero revenue and reported recurring quarterly losses.
-
Q3 2025 missed, posting a wider $0.20 loss per share vs. consensus $0.13, highlighting execution struggles.
-
Flagship projects expected to come online only in late 2027 or 2028. Early demos remain delayed due to permitting, supply chain, and regulatory holdups.
Technical Breakdown
Oklo’s price chart paints a cautionary tale:
-
A sharp 40% drawdown in 30 days as momentum faded.
-
Breakdown below the 50-day SMA and the neckline of a well-formed ‘head and shoulders’ pattern—textbook signs of a trend reversal.
-
Bearish MACD crossover confirms that sellers are firmly in control.
Broader Sector Pain
-
Many clean energy and nuclear-related stocks saw speculator-driven runups in spring 2025, followed by sharp profit-taking and rotations into more stable names.
-
Investors appear impatient with “story stocks” where projected profits are years away—rising rates compound this impatience.
Strategies for Oklo Profits
-
If you entered during the surge, selling even some here crystallizes hard-won gains and frees liquidity for faster-growing or less risky opportunities.
-
Aggressive traders can use protective puts, covered calls, or dynamic stop-losses.
Portfolio Strategy: How to Rotate, Hedge, and Prepare for the Next Market Move

Diversification and Rebalancing
When the market shifts from bull to choppy, the “everything goes up” mindset breaks. Smart investors:
-
Trim winners: Rebalance overexposed positions into laggards or fresh ideas.
-
Reassess sectors: Seek exposure to defensive industries (utilities, consumer staples, health care) as volatility rises.
-
Hedge: Consider using VIX products, inverse ETFs, or option collars to protect overall portfolio value.
Building a Cash Buffer
Having a cash position isn’t defeatist—it’s strategic. By selling partial positions in overstretched or breakdown-prone stocks, you create ‘dry powder’ for inevitable corrections and new opportunities. This approach also reduces portfolio stress and enables nimble strategic moves.
Redefining Risk
With new tech cycles accelerating and government policy frequently shifting winners and losers, risk management means flexibility:
-
Watch margin and leverage levels.
-
Avoid “all-in” allocations to any single big winner.
-
Use tiered profit targets and trailing stops.
Opportunities After a Sell-Off
-
Growth stocks tend to over-correct, establishing new bases for the next leg up.
-
Value stocks become more attractive as bear markets compress multiples.
-
Thematic ETFs let you ride sector trends with built-in diversification.
Case Study Comparisons: Past Winners That Became Top Sells
Tesla (2021):
After a 700% run, Tesla corrected more than 30% as investors digested competition, regulatory worries, and multiple expansion. Early profit-takers outperformed those who waited for reacceleration.
Zoom (2020):
Zoom surged with the “work-from-home” boom, then fell by half as growth rates normalized. Smart investors rotated to reopening plays.
Beyond Meat (2019):
IPO mania pushed shares to unsustainable heights—selling on early warning signs allowed redeployment at better risk/reward points.
Key Lesson:
Profit-taking during “euphoric” market stretches provides both relative and absolute performance boosts in volatile years.
Advanced Technical Analysis for Profitable Selling
SMA, MACD, RSI Tutorials
-
Simple Moving Average (SMA): The 50- and 200-day SMAs act as support/resistance; breakdowns below often signal deeper corrections.
-
MACD (Moving Average Convergence Divergence): When the MACD line crosses below its signal line, bearish momentum increases. Confirm with volume and recent trend.
-
Relative Strength Index (RSI): An RSI above 70 is typically ‘overbought’; below 30 is ‘oversold.’ Falling RSI after a strong bull run signals risk of correction.
Reading Chart Patterns
-
Head & Shoulders: Signal reversal; neckline breakdowns mark an exit for momentum traders.
-
Double Top: Tests of a previous peak without new highs frequently presage reversals.
Options for Protection
-
Protective Puts: Buy puts on winners to cap downside while allowing further gains.
-
Collars: Combine a protective put with a covered call to partially fund insurance.
-
Stop-Loss Orders: Automated triggers to exit at preset price levels—perfect for those unable to monitor positions daily.
Sector Impacts and Macro Takeaways
-
Market volatility shakes loose not just highfliers, but entire industry cohorts. Investors crowding into fads may see reversals as rates rise or growth slows.
-
Winners in one regime often become the first to correct.
-
Reallocating to steady income sectors (dividend aristocrats, real estate, utilities) can reduce drawdown and keep portfolios “in the game.”
Conclusion: Smart Selling and Next Steps
In 2025, with headline-driven volatility and rapid sector transitions, learning to sell your winners is as critical as knowing what to buy.
Oracle, Pagaya, Robinhood, and Oklo each represent a class of stocks that have rewarded bold holders—yet are now serving up warning signs, both technical and fundamental.
Selling is not defeat. It’s opportunistic risk management. By locking in gains, rotating to better prospects, and keeping a sharp eye on charts and changing conditions, you’ll turn today’s volatility into tomorrow’s advantage.
Take action:
-
Review your winners for signs of topping
-
Protect gains
-
Don’t fear cash or safe harbors
-
Prepare for the next rotation—market cycles never pause!
Frequently Asked Questions
Should I sell all or just trim?
“Trim” usually works best—capture partial gains, tighten stop-losses, and avoid “all or nothing” bets.
What’s the best sign a winner is topping?
Rapid loss of support (like the 50-day SMA) and rising volume on down-days are clear warnings.
Are options just for the pros?
Not anymore—many brokerages support simple protective options. Learn basics before deploying, but they are robust tools for limiting risk.
Is moving into cash a losing strategy?
In volatile or topping markets, cash becomes a strategic asset, ready to deploy when better risk/reward emerges.
How often should I rebalance?
Review monthly or quarterly, but react if charts show technical trend breaks or macro news shocks the market.