The market right now is moving like it has one foot on the gas and one on the brakes. Some sectors are surging while others are rolling over, volatility is creeping up, oil prices are retreating, and investor sentiment is being shaped by a mix of geopolitical tension and high-profile policy decisions. In this kind of environment, knowing which assets are likely to lead the next move is crucial for staying ahead.
Even though the headlines often focus on drama, the truth is that the clues to the market’s next act are visible if you know where to look. Price action, sector rotation, institutional flows, and macroeconomic indicators all provide hints. In the coming week, these signals will become even more important as the market digests ongoing uncertainty and positions itself ahead of potential catalysts, including major policy decisions and macroeconomic reports.
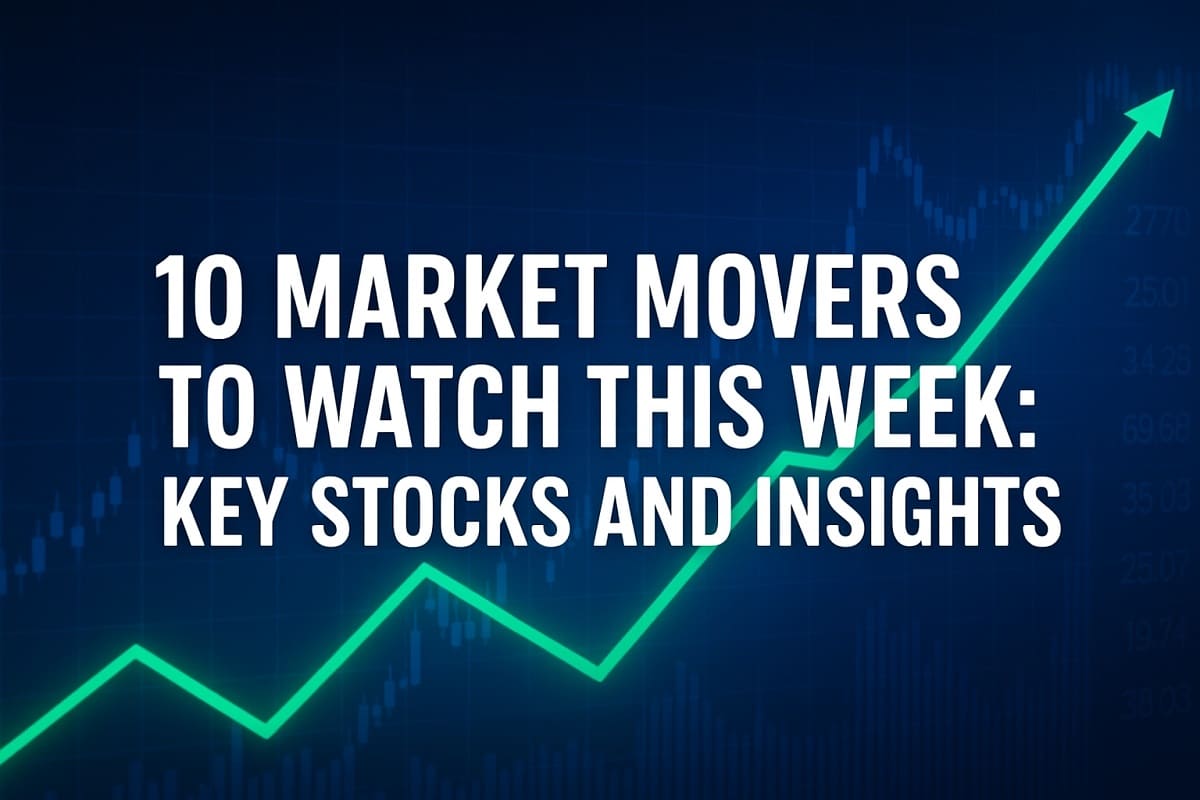
This article walks through the 10 most important stocks and ETFs to watch this week, breaking down what their movements indicate, why they matter, and how they could influence broader market trends. From traditional indices to tech giants, commodities, and the ever-watchful VIX, understanding these movers gives investors an edge in anticipating opportunities and risks.
The Market’s Current State: Volatility, Momentum, and Macro Signals
The broader market has shown resilience in recent weeks, but the underlying picture is more nuanced. The Dow Jones Industrial Average recently hit a record high, signaling strength among large-cap, blue-chip stocks, yet sectors such as tech and energy show uneven performance. Volatility remains elevated compared to historical averages, suggesting that while the market can climb, sudden pullbacks are still possible. Traders must monitor the interplay of institutional flows and retail sentiment, as shifts in these forces often set the tone for short-term trends.
Oil and natural gas markets are sending mixed signals, with prices reacting to global supply dynamics, winter demand forecasts, and geopolitical events. Precious metals like gold and silver are acting as traditional safe havens, responding to investor concerns about inflation and monetary policy. Meanwhile, Treasury bonds reflect investor expectations for future rate movements, making ETFs such as TLT essential for tracking the bond market’s sentiment.
Against this backdrop, understanding individual movers—whether equities, ETFs, commodities, or volatility measures—provides a framework for anticipating market shifts and positioning portfolios strategically.
Deep Dives into the Top 10 Market Movers
The following sections will analyze each of the 10 key market movers in detail, providing context, recent price action, underlying fundamentals, and potential implications for the market.
1. SPDR Dow Jones Industrial Average ETF Trust (NYSE: DIA)
The Dow Jones Industrial Average has long been considered the “old guard” of the stock market, representing the most established, blue-chip companies in the United States. The SPDR Dow Jones Industrial Average ETF Trust (DIA) provides a way to track this index efficiently, giving investors exposure to large-cap stability and the cyclical dynamics of industrial, financial, and consumer-focused giants.
As of early December, DIA has recently cleared record highs, signaling continued bullishness among institutional investors. This breakout indicates that confidence in blue-chip stocks remains robust, even amid broader market uncertainty. The fact that the Dow has held above these levels suggests that investors are positioning for continued economic resilience. However, the underlying market dynamics also reveal mounting pressures. Some sectors within the Dow are under strain, reflecting the tug-of-war between growth and value stocks. If these pressures intensify, DIA could experience temporary volatility despite the bullish trend.
Investors should note that DIA’s performance is often a bellwether for the broader market. The ETF encapsulates not just individual stock movements but also sentiment across multiple sectors. A sustained breakout signals institutional money leaning into large-cap equities, which could stabilize other indexes, while a reversal might foreshadow broader weakness. For traders and long-term investors alike, monitoring DIA’s trend provides insight into market leadership, capital flows, and investor confidence heading into the week.
In addition, DIA can be a key tactical tool for managing exposure to economic cycles. Industrial stocks within the ETF are sensitive to macroeconomic conditions such as manufacturing output, trade policies, and consumer demand. As policy developments unfold and economic indicators are released, DIA’s movements can help investors anticipate shifts in risk appetite and sector rotation.
2. SPDR S&P 500 ETF (NYSE: SPY)
The SPDR S&P 500 ETF (SPY) tracks the broader U.S. equity market, representing the performance of 500 large-cap stocks across diverse sectors. SPY’s movements provide critical insight into the overall health of the market and the collective sentiment of investors toward economic and corporate fundamentals.
Earlier this year, SPY experienced a strong rally, particularly around Memorial Day, fueled by optimism about economic recovery and the potential for corporate earnings growth. However, concerns over valuation, coupled with warnings about a potential “AI bubble” in technology stocks, triggered a temporary pullback. This retreat reflected investor caution, especially as markets contended with rising interest rates and uncertainty surrounding Federal Reserve policy.
Since that pullback, SPY has regained momentum, surpassing previous highs and approaching new resistance levels as of early December. This rebound signals that investor confidence is returning, although caution is still warranted. The ETF’s performance suggests that while risk appetite is currently healthy, any adverse macroeconomic news or unexpected market shocks could quickly reverse the trend. Traders watching SPY will look closely at support and resistance zones, volume trends, and sector performance to gauge whether the current rally is sustainable.
SPY is also particularly important for understanding sector rotation. Large-cap tech, consumer discretionary, and energy stocks within the index often lead movements, providing early signals for broader market trends. When SPY rallies, it tends to lift other ETFs and individual equities, creating ripple effects across both institutional and retail portfolios. Conversely, a downturn in SPY frequently acts as a warning sign for increased market volatility, prompting investors to consider hedging strategies or defensive allocations.
For those looking to make informed decisions in the coming week, SPY offers a snapshot of both optimism and caution in the market. Its movement reflects the interplay of economic data, earnings reports, and policy developments, making it an essential benchmark for any market observer.
3. Invesco QQQ Trust (NASDAQ: QQQ)
The Invesco QQQ Trust (QQQ) tracks the Nasdaq-100, a collection of 100 of the largest non-financial companies listed on the Nasdaq, predominantly technology and growth-oriented stocks. As such, QQQ acts as a barometer for tech leadership and innovation-driven market momentum. In 2026, QQQ continues to play a pivotal role in determining overall market direction, as tech stocks often lead both rallies and corrections.
Recently, QQQ hit highs near 635, reflecting strong investor enthusiasm for technology, AI-driven companies, and cloud computing firms. After a brief pullback, the ETF rebounded and broke through those prior highs, signaling that tech remains at the forefront of market gains. This breakout is critical because technology not only drives equity performance but also sets sentiment for risk-on or risk-off behavior. When tech leads upward, it can lift broader indices, while a decline in tech often triggers cascading weakness across multiple sectors.
Investors watching QQQ should consider both fundamental and technical factors. On the fundamental side, tech companies are benefiting from continued demand for AI, semiconductors, software-as-a-service, and digital infrastructure. Earnings growth, innovation, and institutional investment flows provide a supportive backdrop. On the technical side, momentum indicators, volume trends, and breakout levels help signal potential continuation or reversal patterns. For example, a sustained move above recent highs may indicate further upside, while failure to hold support levels could prompt a broader market pullback.
Another critical factor for QQQ in 2026 is volatility. Tech stocks tend to react quickly to news, policy changes, and interest rate expectations. Even as QQQ demonstrates strength, traders must be alert for sudden spikes in volatility that could shift market sentiment. Understanding how QQQ behaves in both bull and bear scenarios provides investors with a clearer view of market risk and reward, making it an indispensable tool for portfolio strategy.
The iShares 20+ Year Treasury Bond ETF (TLT) tracks long-term U.S. Treasury bonds, serving as a critical gauge for interest rate expectations, inflation sentiment, and risk appetite. Bonds, particularly long-duration Treasuries, react inversely to changes in yields, making TLT an essential instrument for monitoring monetary policy impact on markets.
Currently, TLT sits at a technical crossroads. Short-term, medium-term, and long-term trends are converging, creating a scenario akin to traffic at a four-way stop. A decisive move in either direction could signal broader market expectations regarding interest rates. A bounce in TLT may indicate investor anticipation of rate cuts or slowing economic growth, while a breakdown could suggest continued confidence in higher rates and rising yields.
Monitoring TLT provides indirect insight into equity markets. Rising bond prices (falling yields) often support risk assets like stocks, while declining bond prices (rising yields) can pressure growth stocks, especially in the tech sector. This makes TLT an essential tool for understanding the interplay between fixed income and equities. Additionally, TLT can be used tactically within portfolios to hedge interest rate risk or capture gains from shifts in monetary policy expectations.
Beyond technical and macro considerations, TLT’s movements reflect broader investor psychology. In periods of uncertainty or geopolitical tension, demand for long-term Treasuries often rises, pushing prices higher. Conversely, optimism about economic growth and corporate earnings can depress TLT prices as investors rotate toward equities. Understanding these dynamics allows traders and long-term investors alike to interpret market sentiment and position portfolios more strategically.
For 2026, TLT remains one of the most closely watched ETFs, not just for bond investors, but also for those analyzing equities, commodities, and alternative assets. Its behavior offers a window into the underlying forces shaping market decisions and serves as an early-warning system for potential shifts in risk appetite.
5. United States Oil Fund (NYSE: USO)
The United States Oil Fund (USO) provides investors with exposure to crude oil prices, serving as a proxy for energy market trends and inflation signals. Oil remains a key driver of both global economic activity and investor sentiment, and USO’s movements can have ripple effects across equities, commodities, and currencies.
Recently, USO has shown mixed signals. While the longer-term trend had been downward, with lower highs and lower lows, recent price upticks suggest a potential shift in momentum. These moves may be influenced by emerging winter demand, geopolitical tensions, and supply disruptions from key oil-producing regions. For investors, monitoring USO provides clues not only about energy prices but also about inflationary pressures, which directly affect interest rates and, consequently, equity valuations.
Investing in USO requires careful attention to both technical patterns and macroeconomic drivers. Breakouts above resistance levels may signal renewed buying interest, while failure to maintain support can indicate continued weakness. Additionally, energy ETFs like USO often react to inventory reports, OPEC+ production decisions, and geopolitical events, making them sensitive to news flow and market sentiment. For traders and long-term investors alike, USO offers a critical window into one of the most volatile and influential markets in the world.
6. United States Natural Gas Fund (NYSE: UNG)
The United States Natural Gas Fund (UNG) tracks the price of natural gas, an energy commodity with pronounced seasonal volatility. Natural gas markets respond to weather patterns, storage levels, and supply-demand dynamics, making UNG a key indicator for both energy investors and broader macroeconomic trends.
Since mid-October, UNG has been rebounding off prior lows, approaching key breakout levels around $15.50. This upward momentum is largely driven by winter demand expectations and tightening supply conditions. Cold weather forecasts can amplify buying interest, and a sustained breakout could signal a more extended rally. For traders, UNG provides not only a trading opportunity but also insight into inflationary pressures, energy consumption patterns, and risk sentiment in related sectors.
UNG also plays a strategic role in portfolio diversification. Its movements often diverge from equities, providing potential hedging benefits. As natural gas is an input for both industrial production and residential heating, UNG’s performance reflects broader economic activity as well as seasonal energy demand. Monitoring this ETF can help investors anticipate shifts in energy-related equities and macro trends, giving them an actionable edge in positioning for volatility or hedging inflation risk.
SPDR Gold Shares (GLD) is the leading ETF for tracking gold prices, which have historically served as a safe-haven asset in times of economic uncertainty. In 2026, gold continues to be influenced by inflation expectations, interest rates, geopolitical tensions, and currency fluctuations.
After hitting all-time highs in October, GLD experienced a period of consolidation but has recently surged to a six-week high. This movement signals renewed investor interest in gold as a hedge against risk and potential inflation. Gold tends to perform well when markets face uncertainty, providing insurance against volatility in equities, commodities, and currencies. For investors seeking stability, GLD serves as both a store of value and a tactical trading instrument.
Gold’s performance is often influenced by broader macro conditions, including Federal Reserve policy, U.S. dollar strength, and geopolitical developments. When rates remain elevated or global uncertainty rises, gold’s appeal typically increases. Monitoring GLD’s price action alongside other indicators like Treasury yields and market volatility provides insights into investor risk appetite and potential shifts in portfolio allocation.
The iShares Silver Trust (SLV) mirrors GLD in its role as a precious metal investment, but silver exhibits unique characteristics due to its industrial applications. SLV tracks silver prices and can show amplified movements in response to changes in both investor sentiment and industrial demand.
Recently, SLV has mirrored gold’s upward trend, demonstrating the strong correlation between these two precious metals. Silver often follows gold’s lead but can accelerate during rallies due to its dual role as both a commodity and a monetary asset. Investors tracking SLV should watch for breakout levels and volume spikes, as these can signal further upward momentum.
Silver’s performance is also sensitive to macroeconomic developments, industrial demand, and currency fluctuations. SLV offers both a trading opportunity and a portfolio hedge, particularly when equities are volatile or inflation expectations are rising. For investors seeking exposure to precious metals, SLV provides a flexible tool for participating in broader risk-on and risk-off cycles alongside GLD.
9. CBOE Volatility Index (VIX)
The CBOE Volatility Index, commonly known as the VIX, is widely regarded as the market’s “fear gauge.” It measures expected volatility in the S&P 500 over the next 30 days based on options pricing. In essence, VIX provides a real-time reflection of investor sentiment, offering insights into risk-on and risk-off conditions in the equity markets.
Over the past few months, the VIX has fluctuated, with notable spikes in October and early November followed by a drift lower. Current levels, hovering around 18–20, indicate that the market is relatively calm, and investors are comfortable maintaining risk positions. However, sudden upward movements in the VIX typically serve as a warning signal for sharp declines or corrections in equity markets. Traders and portfolio managers often monitor these spikes closely to adjust hedges, rebalance portfolios, or implement defensive strategies.
VIX’s predictive power makes it a unique tool for both traders and long-term investors. A sudden jump signals fear and uncertainty, often preceding market pullbacks, while a steady decline indicates confidence and risk tolerance. By tracking VIX alongside broader market indexes like SPY and QQQ, investors can gauge whether rallies are sustainable or vulnerable to reversals. In 2026, with geopolitical uncertainty and macroeconomic shifts, VIX remains essential for anticipating market behavior and positioning portfolios accordingly.
Additionally, VIX-based ETFs and options provide opportunities to hedge equity exposure or profit from volatility spikes. Understanding VIX dynamics enables investors to interpret not only fear but also potential opportunities arising from temporary market dislocations, making it an indispensable part of a comprehensive market strategy.
10. Alphabet Inc. (NASDAQ: GOOGL)
Alphabet Inc., the parent company of Google, is a technology powerhouse and often serves as a bellwether for innovation-driven market momentum. Unlike ETFs that represent broad indices, GOOGL offers insight into individual corporate catalysts, investor sentiment, and tech sector dynamics.
Recently, Alphabet broke through a ceiling near $290, accelerated by a significant move from Warren Buffett’s Berkshire Hathaway taking a multibillion-dollar position. This event ignited a strong rally, pushing GOOGL above $321 as of early December. The breakout underscores not only the influence of institutional investors but also the enduring appeal of Alphabet’s diverse business model, including search, cloud computing, advertising, and AI-driven ventures.
Investors monitoring GOOGL should consider both short-term catalysts and long-term fundamentals. The stock’s breakout could attract momentum traders and institutional flows, creating additional upward pressure. However, volatility remains a factor, especially in the technology sector, where earnings expectations, AI hype cycles, and regulatory scrutiny can drive sharp swings.
Alphabet’s performance also offers broader insights for the tech-heavy Nasdaq and QQQ ETF. When GOOGL rallies, it often lifts related tech names, influencing sector sentiment and overall index performance. Conversely, any weakness in GOOGL can trigger cascading effects across high-growth stocks. For investors and traders alike, understanding GOOGL’s movements provides a lens through which to view market leadership, innovation trends, and institutional positioning.
How to Use These 10 Market Movers for Profit
The ten market movers outlined in this article span equities, ETFs, commodities, bonds, and volatility measures, offering a comprehensive view of the forces driving markets this week. Each asset provides unique insights:
-
DIA, SPY, QQQ – Track equity momentum, sector leadership, and institutional flows.
-
TLT – Reflects interest rate expectations and bond market sentiment.
-
USO, UNG – Provide early signals of energy demand, inflation, and seasonal trends.
-
GLD, SLV – Offer safe-haven perspective and hedges against uncertainty.
-
VIX – Monitors market fear and risk tolerance.
-
GOOGL – Highlights tech sector catalysts and institutional influence.
By understanding the relationships and interactions among these movers, investors can anticipate potential market trends and adjust portfolios strategically. For example, rising TLT with falling VIX may suggest risk-off sentiment, favoring defensive sectors or precious metals. Conversely, a breakout in QQQ and GOOGL could signal renewed appetite for growth stocks, prompting tactical allocations to technology or innovation-driven equities.
Incorporating these insights into trading strategies or long-term investment decisions provides a distinct edge, helping investors navigate volatility, capture opportunities, and manage risk in a rapidly evolving market environment.
Conclusion: Positioning for the Week Ahead
The next seven days in the market promise a blend of opportunity and caution. By closely monitoring the ten market movers outlined—spanning equities, ETFs, commodities, bonds, and volatility—investors can gain critical insights into where capital is flowing, which sectors are likely to outperform, and how macroeconomic forces might impact portfolios.
Equity ETFs such as DIA, SPY, and QQQ reveal leadership trends in large-cap, broad-market, and tech-heavy sectors. Meanwhile, TLT provides a window into interest rate expectations and bond market sentiment, helping gauge investor risk appetite. Commodities like USO, UNG, GLD, and SLV serve as both indicators and hedges, reflecting energy demand, inflation expectations, and safe-haven strategies. The VIX acts as the ultimate fear gauge, signaling when the market may be turning risk-on or risk-off, while GOOGL demonstrates how a single influential tech stock can drive momentum, sector leadership, and investor psychology.
For investors, the key takeaway is simple: understanding these market movers—and their interconnections—provides an actionable roadmap. Whether trading short-term swings, positioning for sector rotations, or hedging against risk, these ten assets offer clarity amid market complexity. In an environment of rising volatility, geopolitical tension, and macroeconomic uncertainty, paying attention to these movers is not just prudent—it’s essential.
By combining technical analysis, macroeconomic context, and fundamental insights, investors can make more informed decisions, manage risk, and potentially capture opportunities that others might miss. The market is always signaling its next move; the challenge is interpreting those signals correctly. These ten market movers provide a starting point for doing exactly that.
FAQ: Top Questions About This Week’s Market Movers
What are market movers, and why should I watch them?
Market movers are stocks, ETFs, or indexes that significantly impact overall market trends due to their size, liquidity, or sector influence. Monitoring them helps investors anticipate broad market shifts and adjust strategies accordingly.
How do ETFs like DIA, SPY, and QQQ affect my portfolio?
These ETFs provide exposure to major indexes and sectors. DIA tracks large-cap industrials, SPY captures the broad S&P 500, and QQQ focuses on tech-heavy Nasdaq 100 companies. Their performance often signals market sentiment and sector rotation trends.
Why are commodities like USO and UNG important market indicators?
Commodities reflect real economic activity and inflationary pressures. Oil and natural gas prices influence energy costs, consumer spending, and industrial production, making ETFs like USO and UNG key for anticipating broader market trends.
How does TLT help forecast interest rate movements?
TLT tracks long-term U.S. Treasury bonds. Rising TLT prices (falling yields) suggest expectations of rate cuts or slower growth, while declining prices (rising yields) indicate confidence in higher rates. Monitoring TLT offers insight into bond market sentiment and its impact on equities.
What role do GLD and SLV play in uncertain markets?
GLD (gold) and SLV (silver) are safe-haven assets. They tend to rise during periods of market uncertainty, inflation fears, or geopolitical tension, providing a hedge against risk and preserving capital.
How does the VIX signal market risk?
The VIX measures expected volatility in the S&P 500. Higher VIX levels indicate fear and potential market corrections, while lower levels suggest risk-on sentiment. Traders use it to gauge risk appetite and plan hedging strategies.
Why is Alphabet (GOOGL) considered a “market bellwether”?
As a leading tech company, Alphabet influences the performance of other tech stocks and the Nasdaq 100. Institutional moves and earnings reports from GOOGL can drive sector momentum and impact overall market sentiment.
Can these market movers be used for short-term trading?
Yes. ETFs, commodities, and individual stocks like GOOGL respond to both technical signals and news events, making them suitable for short-term strategies. Monitoring trends, breakout levels, and volume can provide actionable insights.
How should investors combine these movers for portfolio strategy?
Diversifying across equities, bonds, commodities, and volatility measures helps balance risk and reward. For example, pairing equities like QQQ with TLT or GLD can hedge against sudden market downturns.
What should I watch this week for signs of market change?
Key indicators include breakout or support levels in DIA, SPY, and QQQ; rising or falling TLT; commodity price movements in USO, UNG, GLD, and SLV; sudden VIX spikes; and news-driven catalysts affecting high-impact stocks like GOOGL.